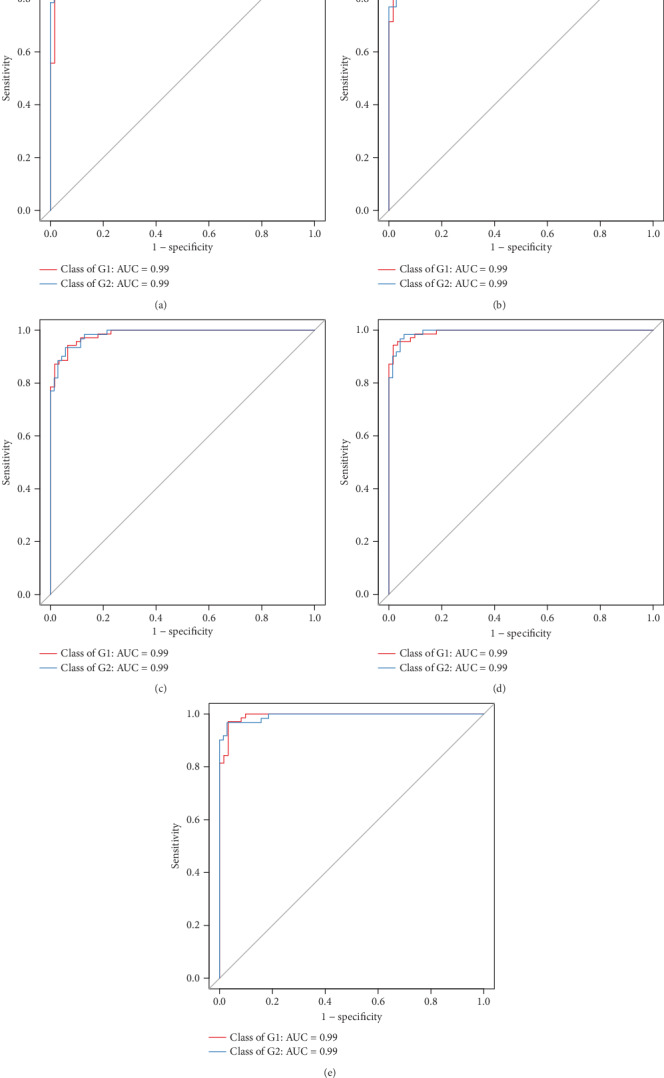
Figure 7.

ROC analysis between the control group (G1) and the liver fibrosis group (G2). The areas under ROC at the phylum (a), class (b), order (c), family (d), and genus (e) were 0.99 for all in differentiating the control and liver fibrosis groups.
