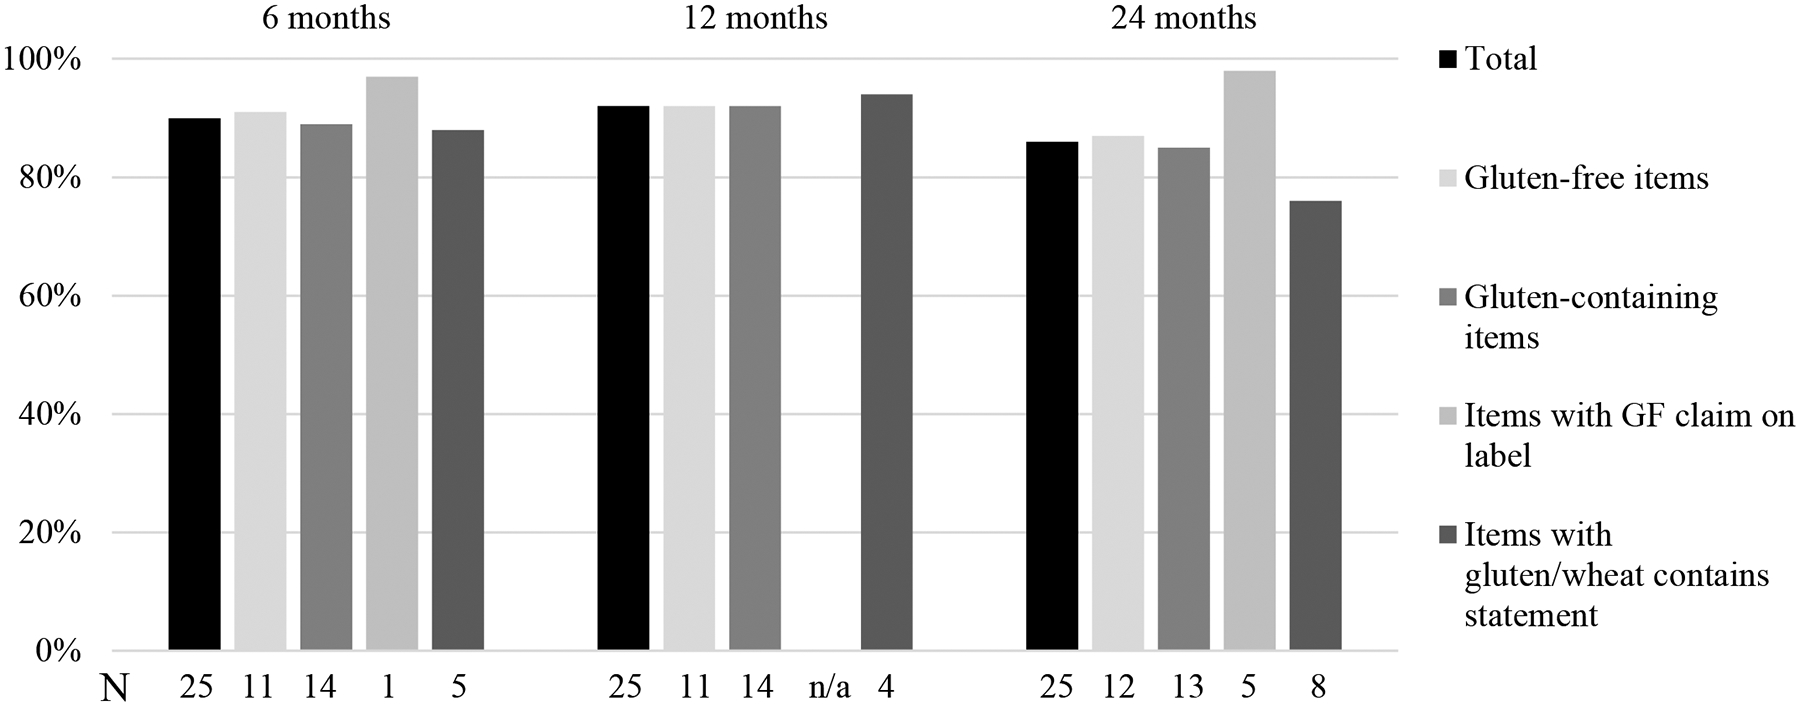
Figure 2. Label reading scores at 6, 12 and 24 months.

For each timepoint, the height of the horizontal bars corresponds to the percent of respondents who correctly identified the gluten-free status of the associated product type. The numbers along the horizontal axis indicate how many products were in each category at each timepoint. There were 115 participants at 6 months, 100 participants at 12 months and 97 participants at 24 months.
