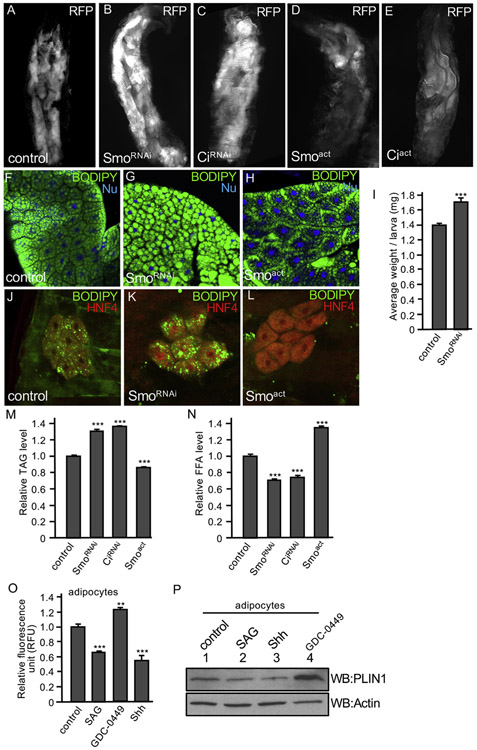
Fig. 1. Hh signaling regulates fat body size and lipid accumulation.
(A) A 3rd instar larva expressing RFP by the fat body-specific cg-Gal4, indicating the fat bodies marked by RFP. (B–E) A larva expressing SmoRNAi, CiRNAi or the constitutively active Smoact, Ciact by the cg-Gal4. Fat bodies are marked by RFP. Male and female larvae have similar pattern in this experiment. (F) A fat body from larvae expressing the fat body-specific ppl-Gal4 in w1118 wild-type background was immunostained for BODIPY (green) and nuclear dye Hoechst 33342 (Nu, blue). (G–H) Fat bodies from larvae expressing SmoRNAi or Ciact by the ppl-Gal4 were stained with BODIPY and nuclear dye. Male and female larvae have similar pattern in this experiment. (I) Larvae from ppl-w1118 (control) or ppl-SmoRNAi were collected and analyzed for their weight. 16 larvae (8 males and 8 females) for each group, with 15 repeats. *** indicates a p < 0.001, versus control (Student’s t-test). (J) Oenocyte from larvae with oen-Gal4-w1118 (control) were immunostained with BODIPY (green) and the anti-HNF4 antibody that marks the oenocyte cells (red). (K-L) Oenocyte from larvae expressing SmoRNAi or Smoact by oen-Gal4 were stained with BODIPY and HNF4. Male and female larvae exhibit similar phenotypes. (M–N) Early 3rd instar larvae expressing Smoact, SmoRNAi, or CiRNAi by ppl-Gal4 combined with tub-Gal80ts were shifted to 29 °C (non-permissive temperature) to inhibit Gal80 expression for 16 h and collected for the analysis of TAG and FFA. Concentration of TAG and FFA was normalized by protein. ppl-Gal4-w1118 served as control. 20 larvae (10 males and 10 females) for each group were collected and the assays were performed with 3 repeats. *** indicates a p < 0.001, versus control in the first column in each assay (Student’s t-test). (O–P) Lipid accumulation regulated by Hh signaling in adipocyte. 3T3-L1 adipocytes were treated with DMSO (control), 200 nM SAG, 100 nM GDC-0449, or 5 nM Shh peptide, followed by staining with BODIPY and subjected to fluorescence activity measurement. RFU: relative fluorescence units. ** indicates a p < 0.01 and *** indicates a p < 0.001, versus control in the first column in each assay (Student’s t-test). 3T3-L1 adipocytes with the same set of treatments were also analyzed by western blots with the anti-PLIN1. Western blot with the anti-Actin antibody serves as loading control.

