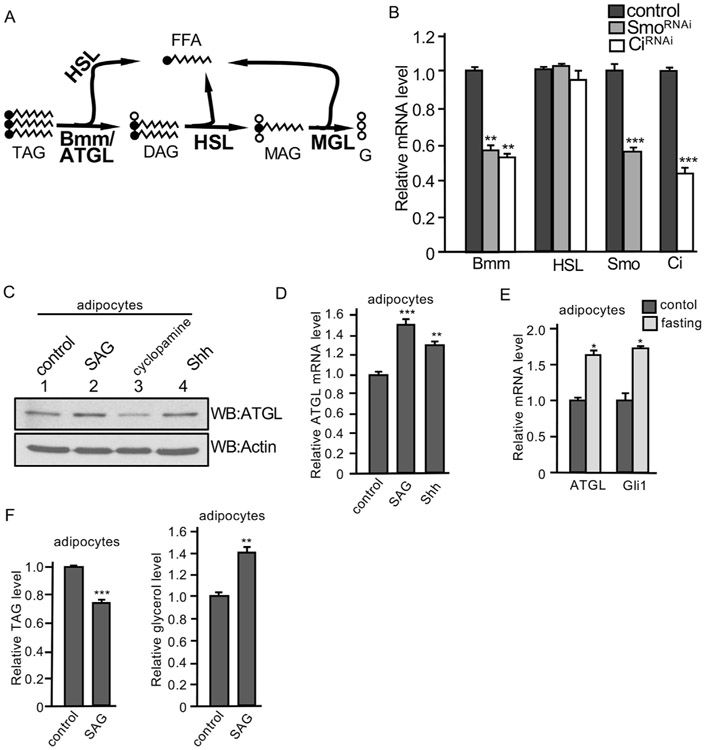
Fig. 4. Hh signaling upregulates Bmm/ATGL transcription.
(A) Scheme of the conversion of TAG, DAG, and MAG in the lipolytic pathway, with FFA and glycerol (G) indicated. Critical enzymes for these reactions are indicated in bold. (B) Fat bodies from late 3rd instar larvae expressing HhRNAi or SmoRNAi by the ppl-Gal4 were collected and mRNA was extracted for RT-PCR analysis to monitor the levels of gene transcription. Fat bodies from ppl-Gal4-w1118 served as control. The right two groups of columns indicate the RNAi efficiency. ** indicates a p < 0.01, and *** indicates a p < 0.001, versus control in the first column in each assay (Student’s t-test). (C) Differentiated 3T3-L1 adipocytes were treated with SAG (200 nM), cyclopamine (10 μM), or Shh (5 nM). Cell lysates were collected and subjected to Western blot with the anti-ATGL antibody. Western blots with the anti-Actin antibody served as loading control. (D) Differentiated 3T3-L1 adipocytes were treated with SAG (200 nM) or Shh (5 nM) and mRNA was isolated for RT-PCR assay to examine the level of ATGL expression. ** indicates a p < 0.01, and *** indicates a p < 0.001, versus control in the first column. (E) RT-PCR assay to examine the transcription of ATGL and Gli1 in differentiated 3T3-L1 adipocytes cultured with either fasting medium containing normal glucose and 1% FBS or control regular medium for 12 h * indicates a p < 0.05, versus control in the first column of each group. (F) Differentiated 3T3-L1 adipocytes were treated with SAG or DMSO (control) and analyzed for their levels of TAG in the cell and secreted free glycerol in the medium. ** indicates a p < 0.01, and *** indicates a p < 0.001, versus control in the first column of each panel.

