
Fig. 5.
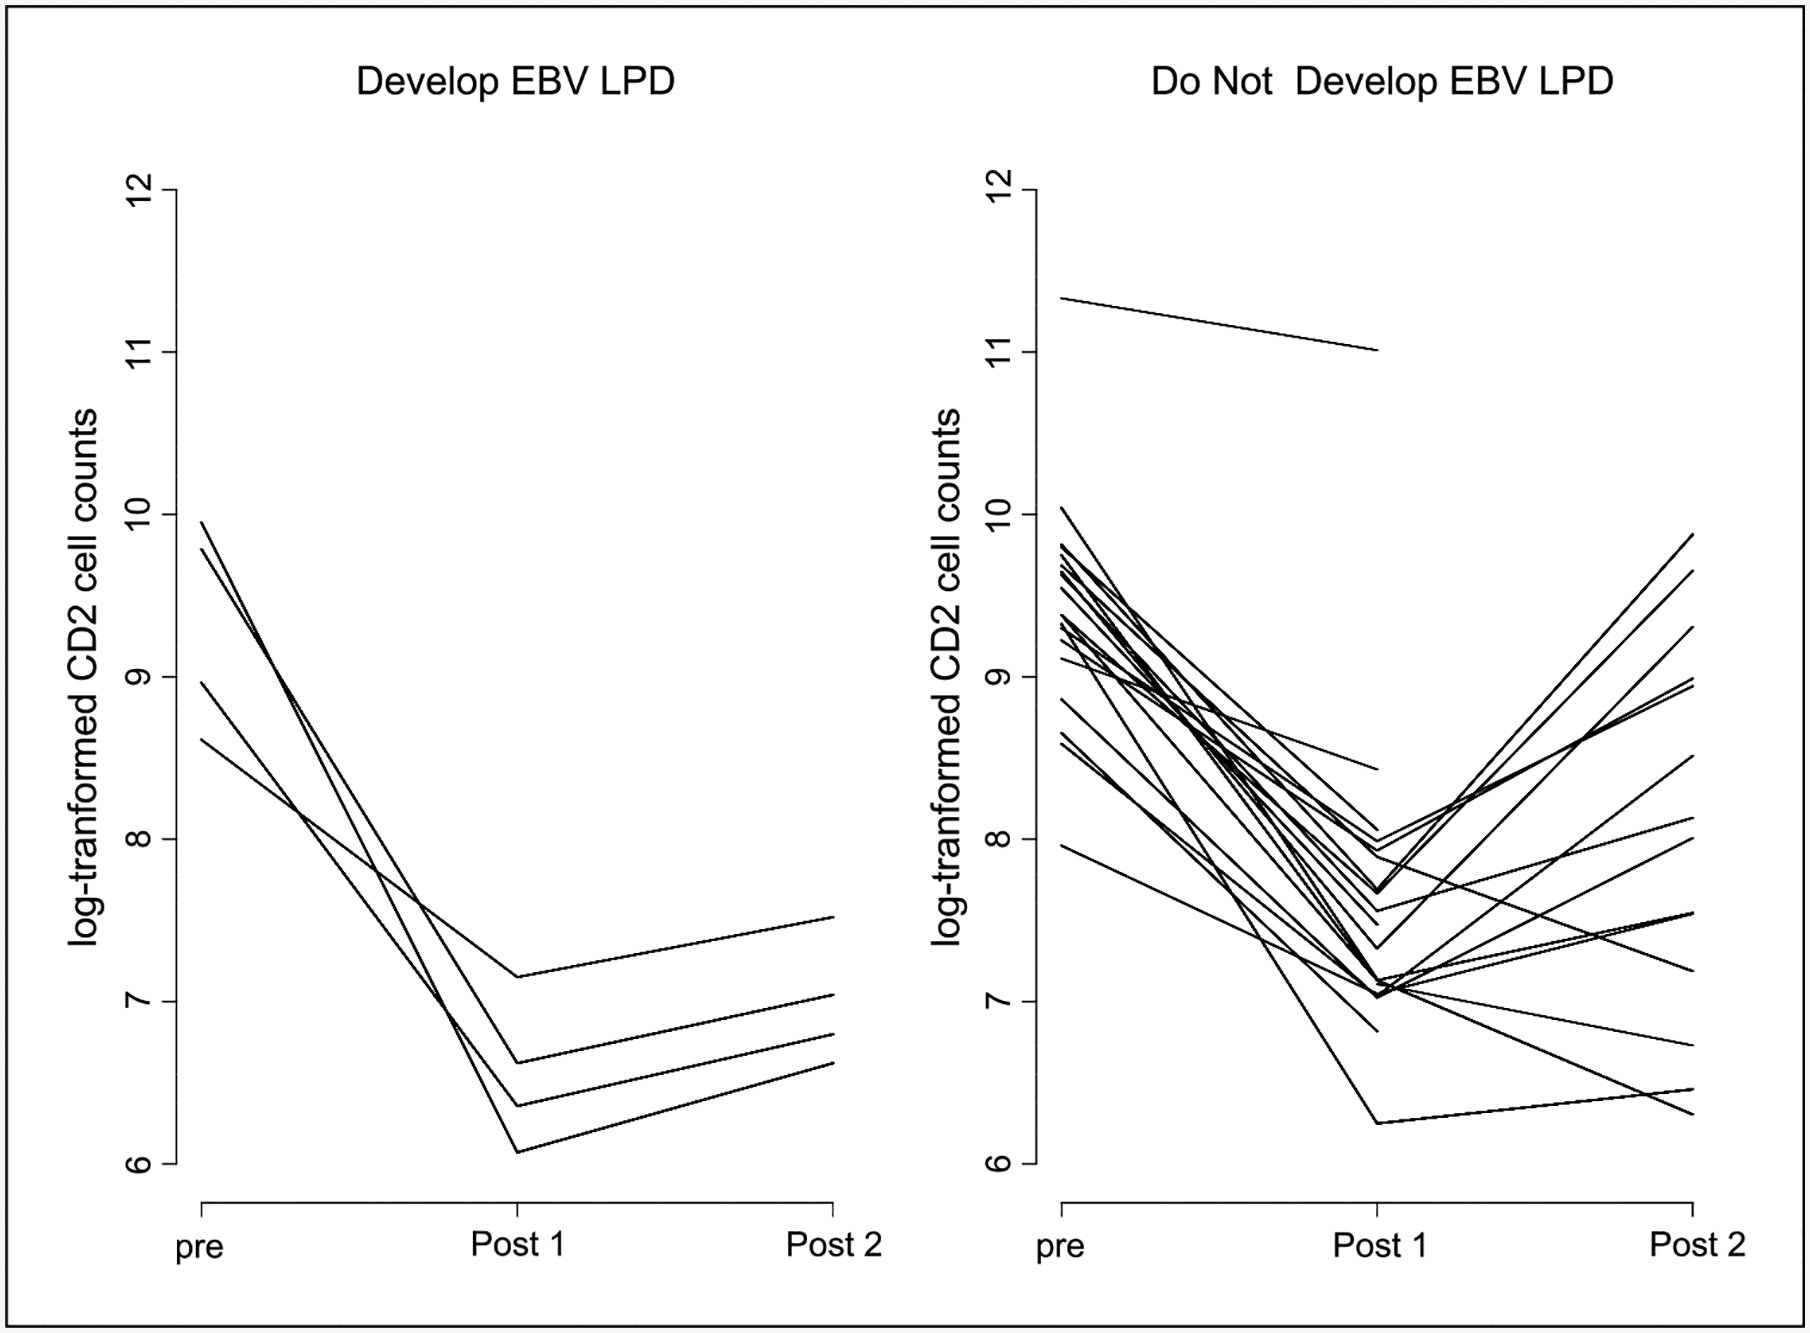
Comparison of trends in CD2 saturation between those who do and do not develop EBV-LPD (P = 0.03) with more sizable changes from baseline for the post-cycle 1and post-cycle 2 measurements for those who develop EBV-LPD.
Official websites use .gov
A
.gov website belongs to an official
government organization in the United States.
Secure .gov websites use HTTPS
A lock (
) or https:// means you've safely
connected to the .gov website. Share sensitive
information only on official, secure websites.
Comparison of trends in CD2 saturation between those who do and do not develop EBV-LPD (P = 0.03) with more sizable changes from baseline for the post-cycle 1and post-cycle 2 measurements for those who develop EBV-LPD.