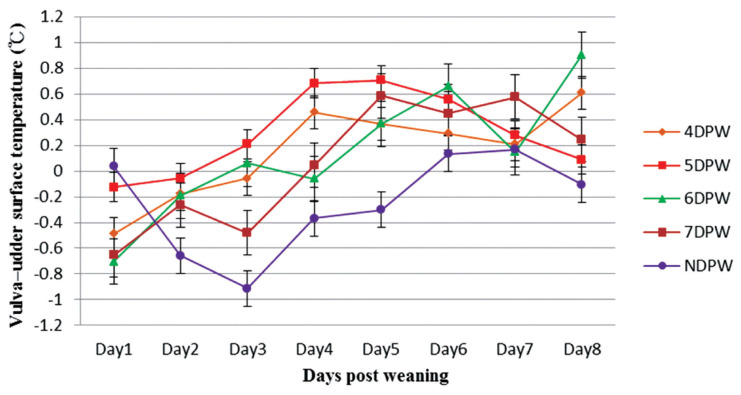
Figure 3.
The variation in vulva–udder surface temperature (°C) from day 1 to day 8 post-weaning for sows with different days to first show behavioural standing heat. The vulva–udder temperature differences of sows were compared four times daily and following the dynamics continuously up to 8 days post weaning (n = 132). DPW, day post-weaning on which heat was first shown; NDPW, day post-weaning on which not detected in standing heat.

