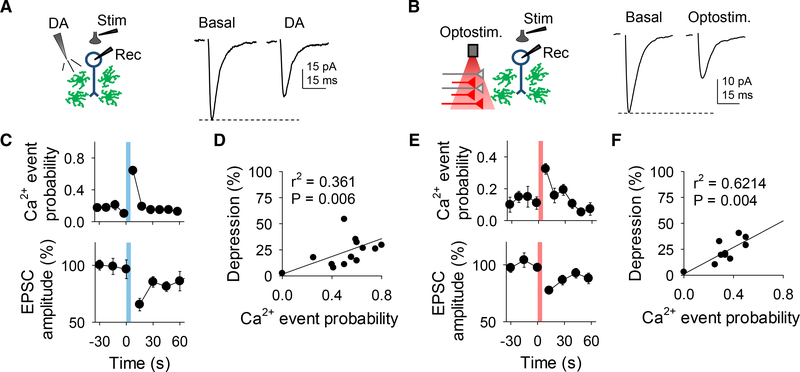
Figure 3. Dopamine Stimulates Astrocyte Ca2+ Increases and Neuronal Excitatory Transmission Depression.
(A) Scheme of the experimental approach (left) and representative EPSC traces before (basal) and after DA application (right).
(B) As in (A) but for optical stimulation.
(C) Ca2+ event probability and relative EPSC amplitude over time.
(D) Relationship between Ca2+ event probability and change in EPSC amplitude after DA application.
(E and F) The same as (C) and (D) but for optical stimulation. Blue and red shadows indicate DA application and optical stimulation, respectively. Data are expressed as mean ± SEM.

