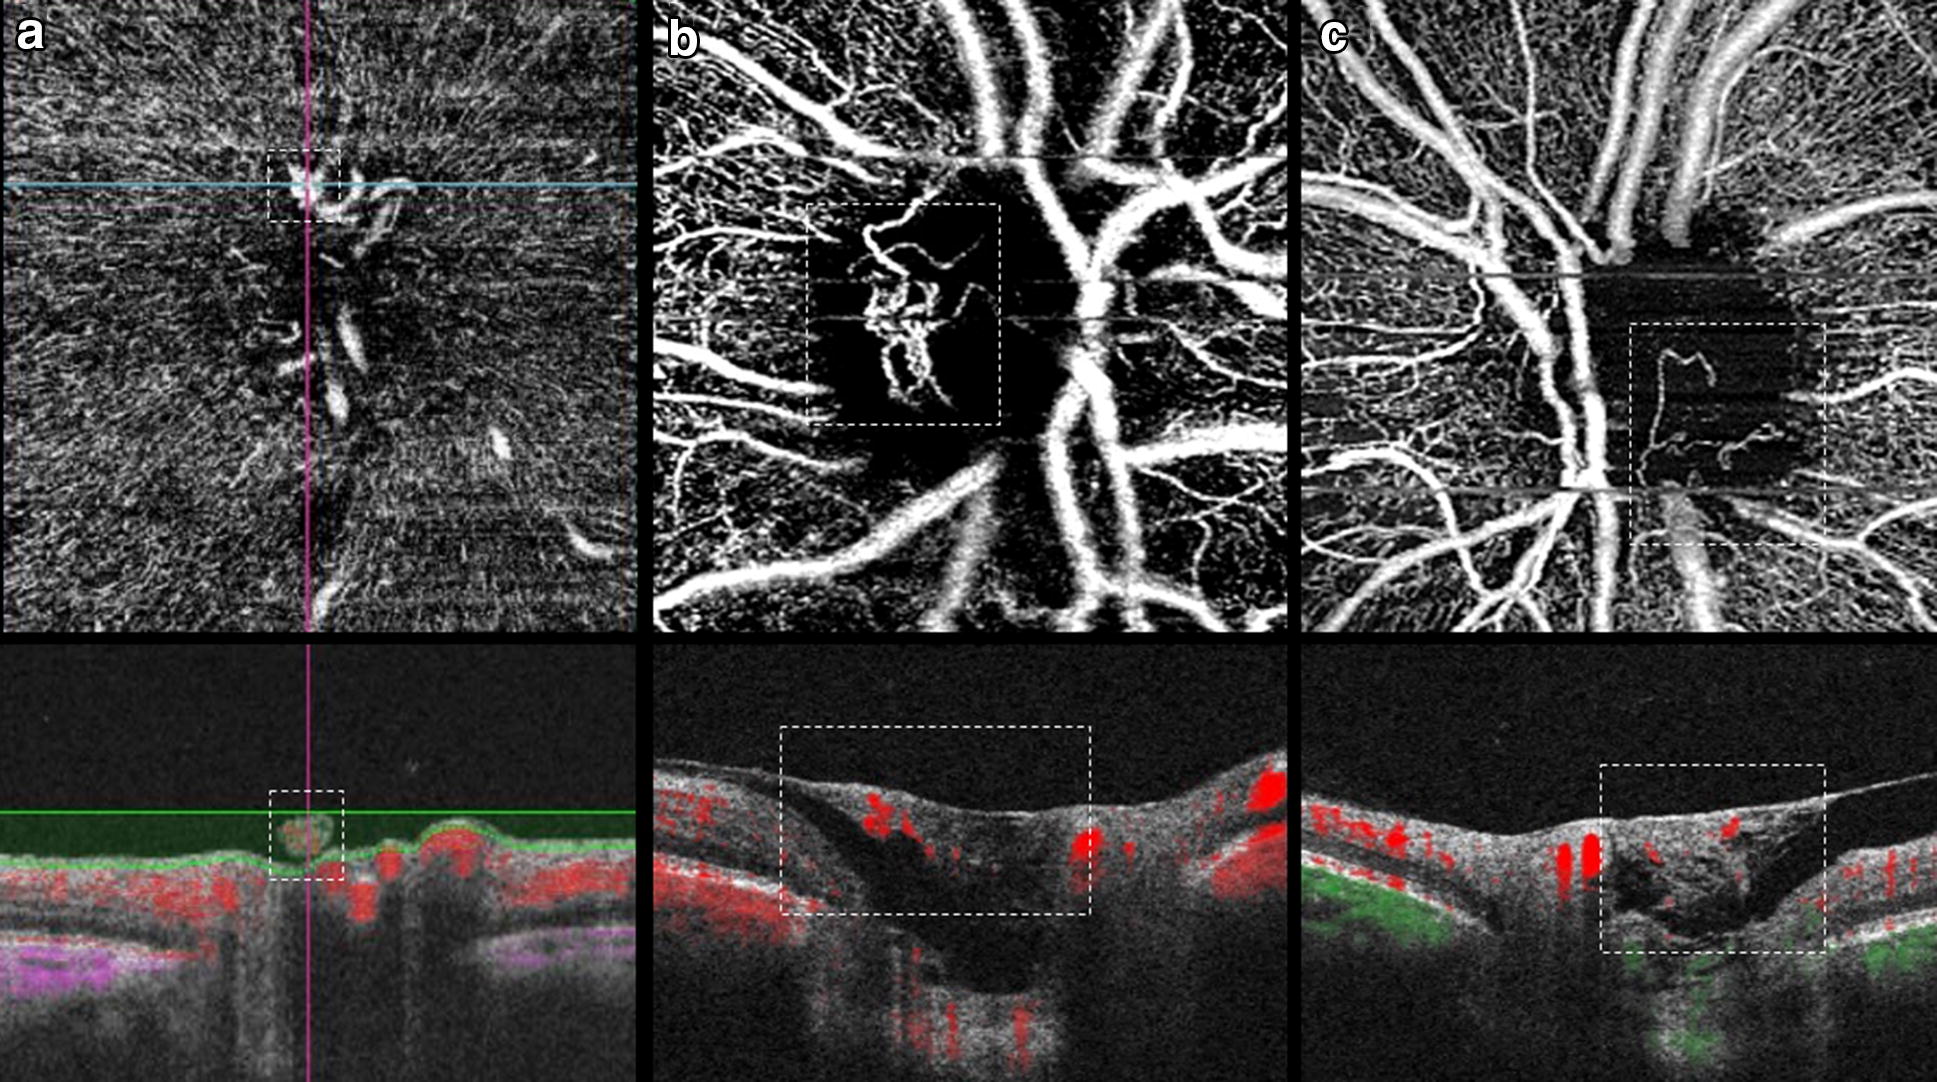
Fig. 3.

Examples of NVD using OCTA. a Swept-Source OCTA showing a small early NVD in the en-face angiogram (dashed line, top), which corresponded in the OCT B-scan to a structure above the disc with positive flow signal (dashed line, bottom), indicating active disease. b SD-OCTA demonstrating an active NVD with irregular new vessels on the en-face image (dashed line, top) and flow signal in red on the OCT B-scan (dashed line, bottom). c Example of an NVD with pruning and little branching on the en-face image (dashed line, top), with fibrotic tissue and minimum flow signal on the co-registered B-scan (dashed line, bottom)
