Fig. 2.
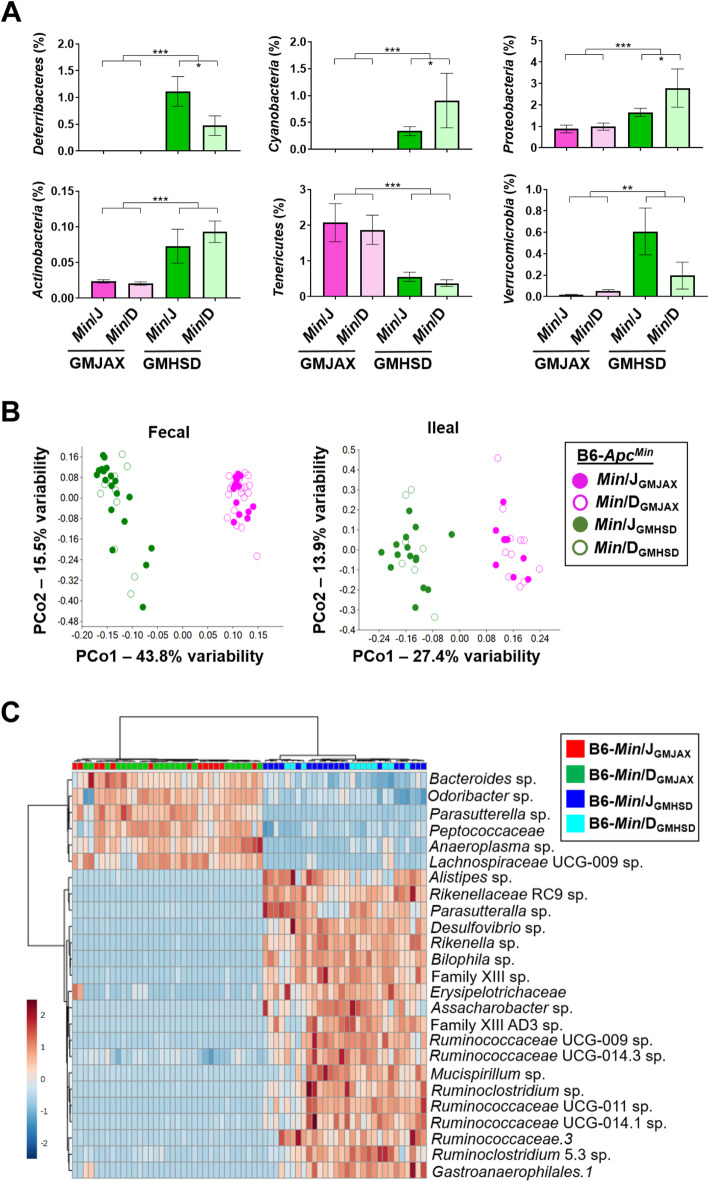
Distinct GM communities influence adenoma susceptibility. a Bar charts representing relative abundances (mean ± SEM) of Phyla with detected significant differences between fecal samples GMJAX and GMHSD groups (Min/JGMJAX,n = 13; Min/DGMJAX,n = 18; Min/JGMHSD,n = 19; Min/DGMHSD, n = 10). b Unweighted Principal Coordinate Analysis (PCoA) representing differences in β-diversity at the Operational Taxanomic Unit (OTU) level between complex GM profiles of CMTR offspring in feces at 1 month, and ileal scrapes at 3 months of age. c Heatmap showing 25 taxa with significantly different (p < 0.001) fecal relative abundances between GMJAX and GMHSD at 1 month, where color intensity represents fold-change of each OTU. Hierarchical clustering based on Euclidean distances (top) demonstrates clustering of samples based on GM. All statistically significant OTUs and associated log-fold changes are represented in supplementary Tables 3A (fecal) and 3B (ileal).*p < 0.05, **p < 0.01, ***p < 0.001; Two-way ANOVA with the Student Newman-Keuls method for Multiple Comparisons

