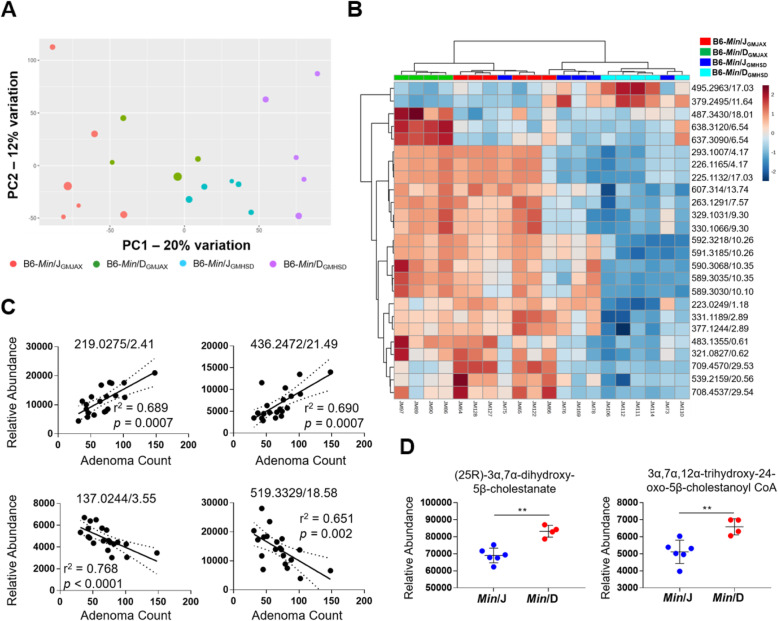
Fig. 3.
Untargeted analysis of GM and host genetic lineage effects on the fecal metabolome. a PCA illustrating unsupervised clustering of fecal metabolites at 3 months of age (Min/JGMJAX,n = 6; Min/DGMJAX,n = 4; Min/JGMHSD,n = 5; Min/DGMHSD, n = 5). b Heatmap showing 25 detected fecal metabolites with most significantly different relative abundances across all rederived groups, where color intensity represents log-fold-change of each metabolite. Hierarchical clustering based on Euclidean distances (top) illustrates primary clustering of samples based on GM, and secondary clustering based on genetic lineage. All metabolites shown on heat map have significantly different mean abundances (p < 0.001) based on ANOVA. c Spearman’s rank correlation was used to show metabolites with significant positive or negative correlations to SI tumor number across all rederived ApcMin groups (n = 20). d Scatter plots of mean ± SEM relative abundances of putative metabolites contributing to modulation of bile acid metabolism (Min/J, n = 6; Min/D, n = 4). Metabolites are denoted by mass:charge ratio and retention time (m/z_tR). *p < 0.05, **p < 0.01, ***p < 0.001; Student’s t-test

