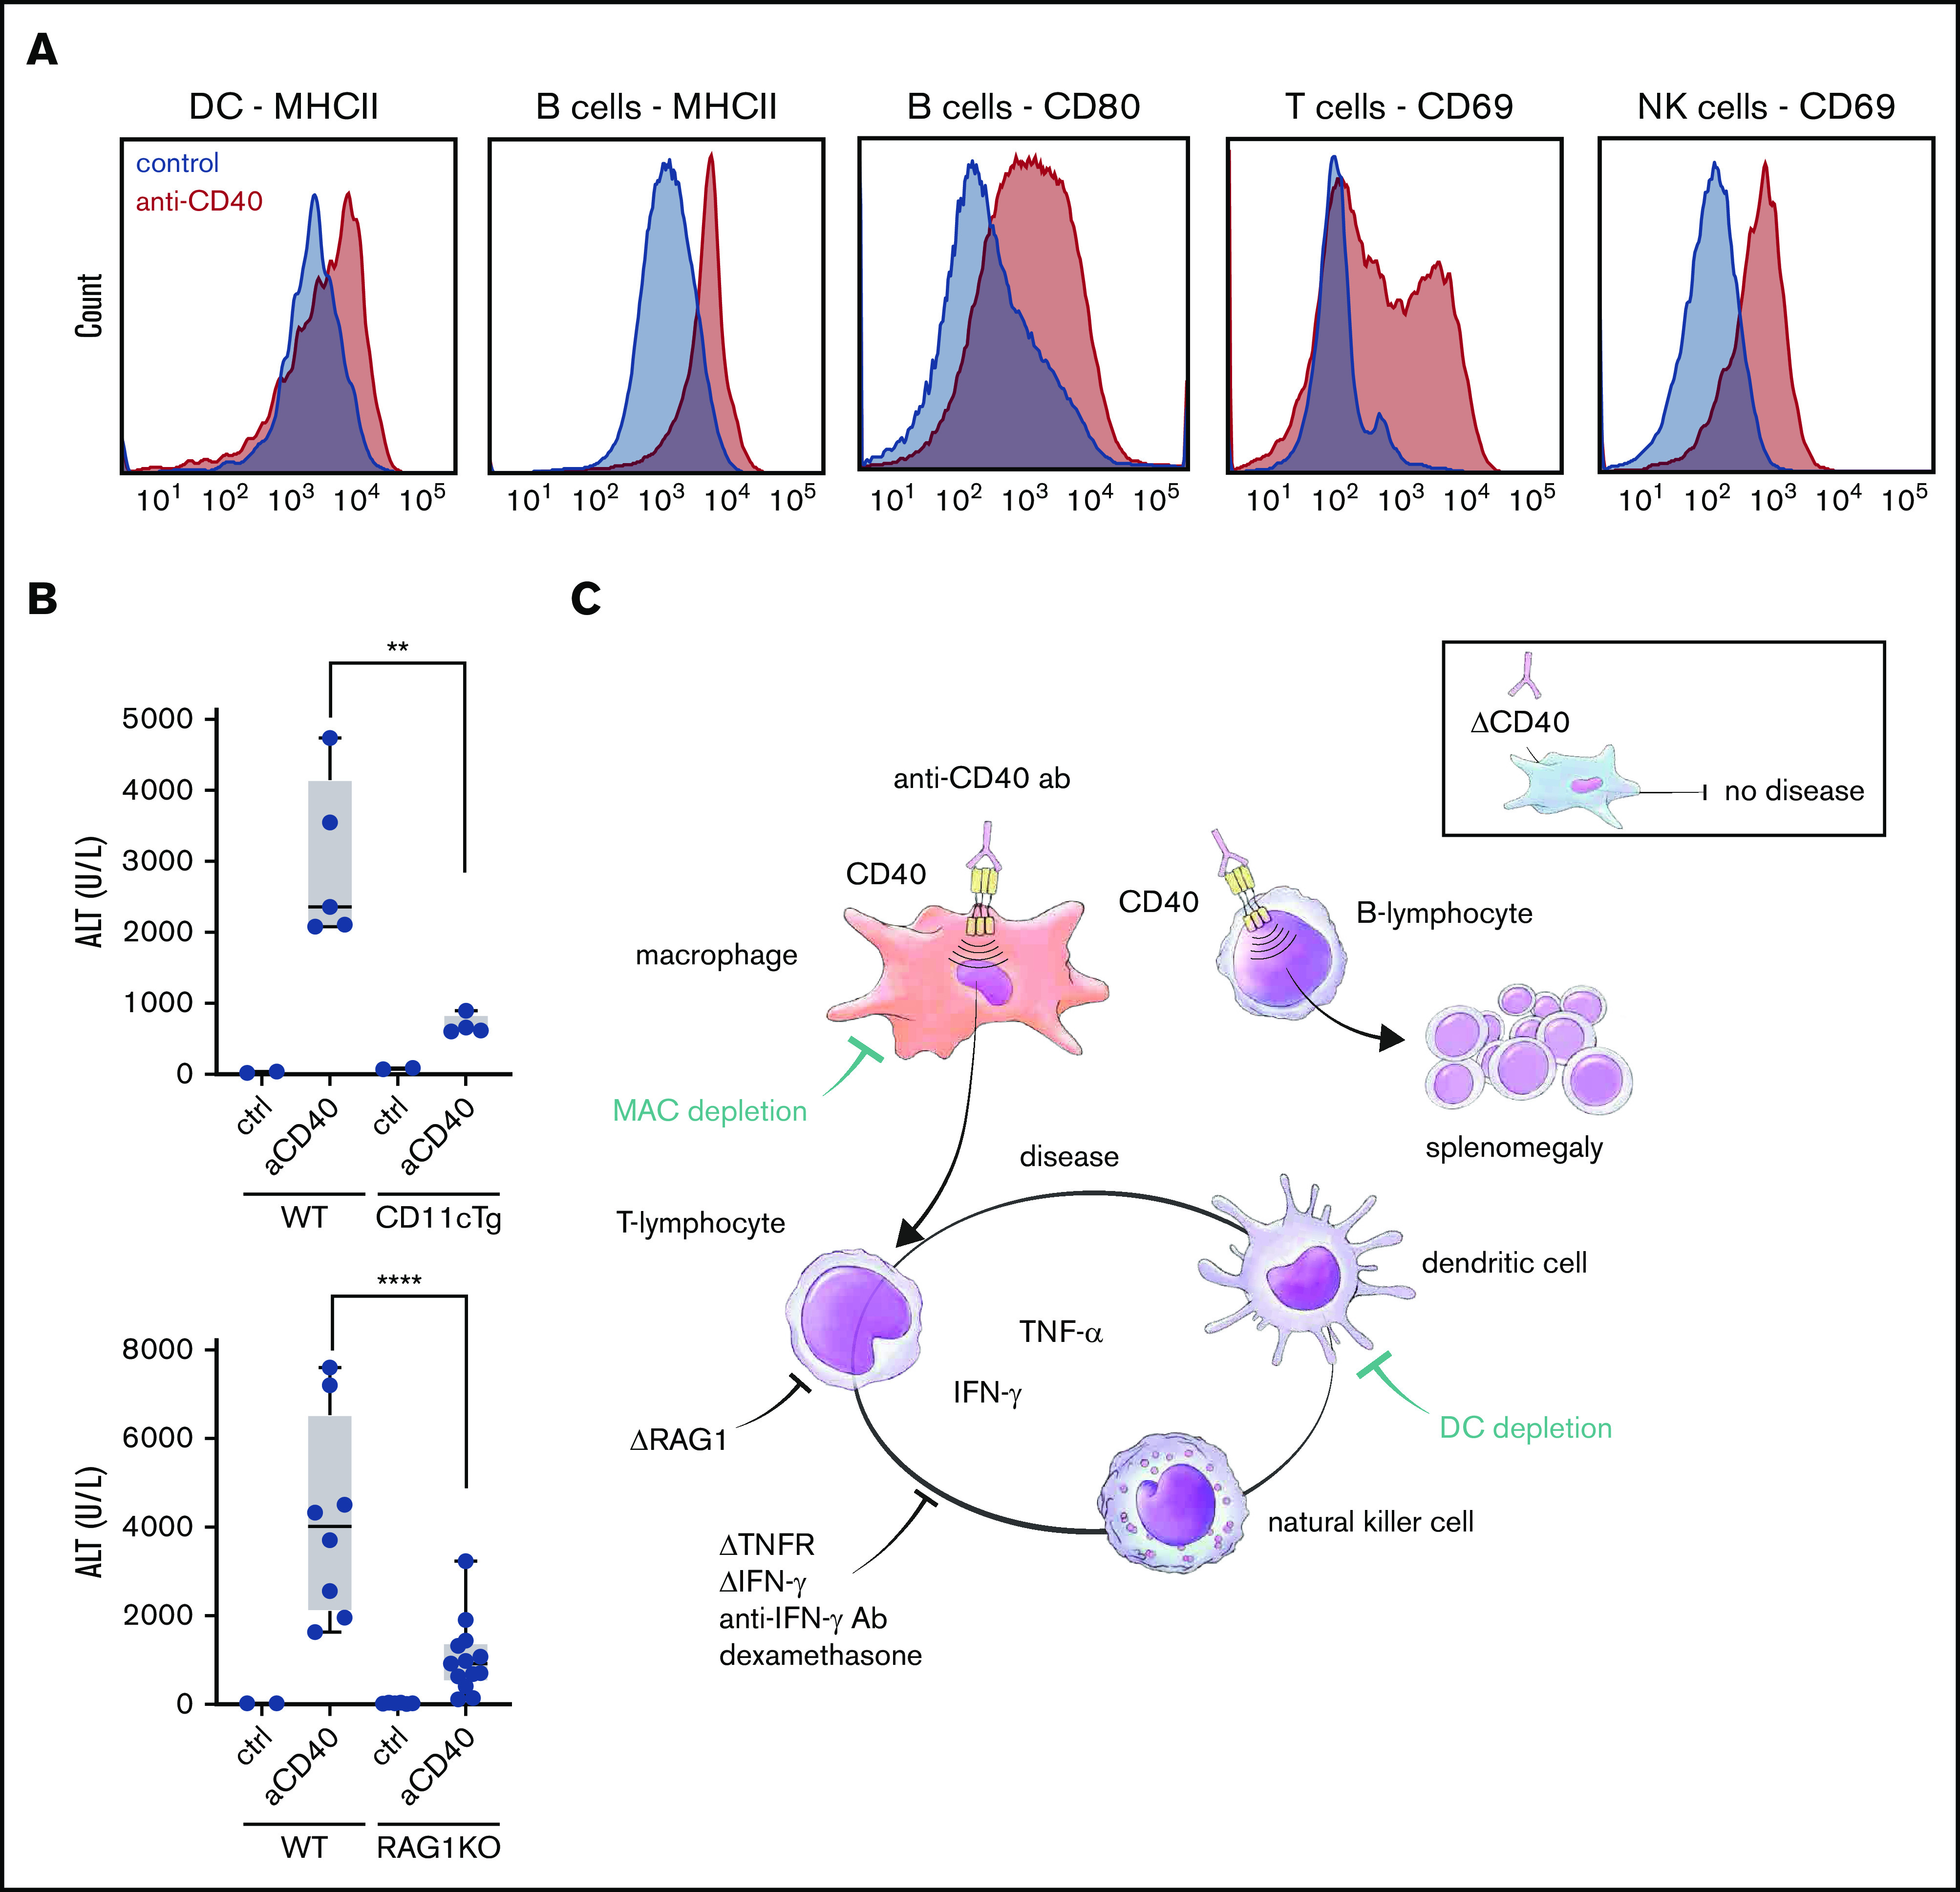
Figure 2.

DCs and lymphocytes aggravate the disease expression. (A) Representative flow cytometric histograms of major histocompatibility complex class II (MHCII), CD80, and CD69 expression of the indicated splenic cell subsets in saline (filled blue histogram) and anti-CD40–treated (filled red histogram) wild-type mice. DCs (CD45high, CD11chigh), B cells (B220high, CD19high), T cells (CD3high, CD8high), NK cells (B220low, CD3low, NK1.1high). (B) Plasma ALT concentrations in saline (n = 2-3) or anti-CD40–treated wild-type (WT) (n = 5-8), CD11cDTg mice (n = 4-5), and RAG1KO mice (n = 8-11). (C) Schematic representation of the anti-CD40–induced hemophagocytic syndrome. Individual symbols represent 1 mouse; ****P < .0001; **P < .01 for all panels.
