Figure 4.

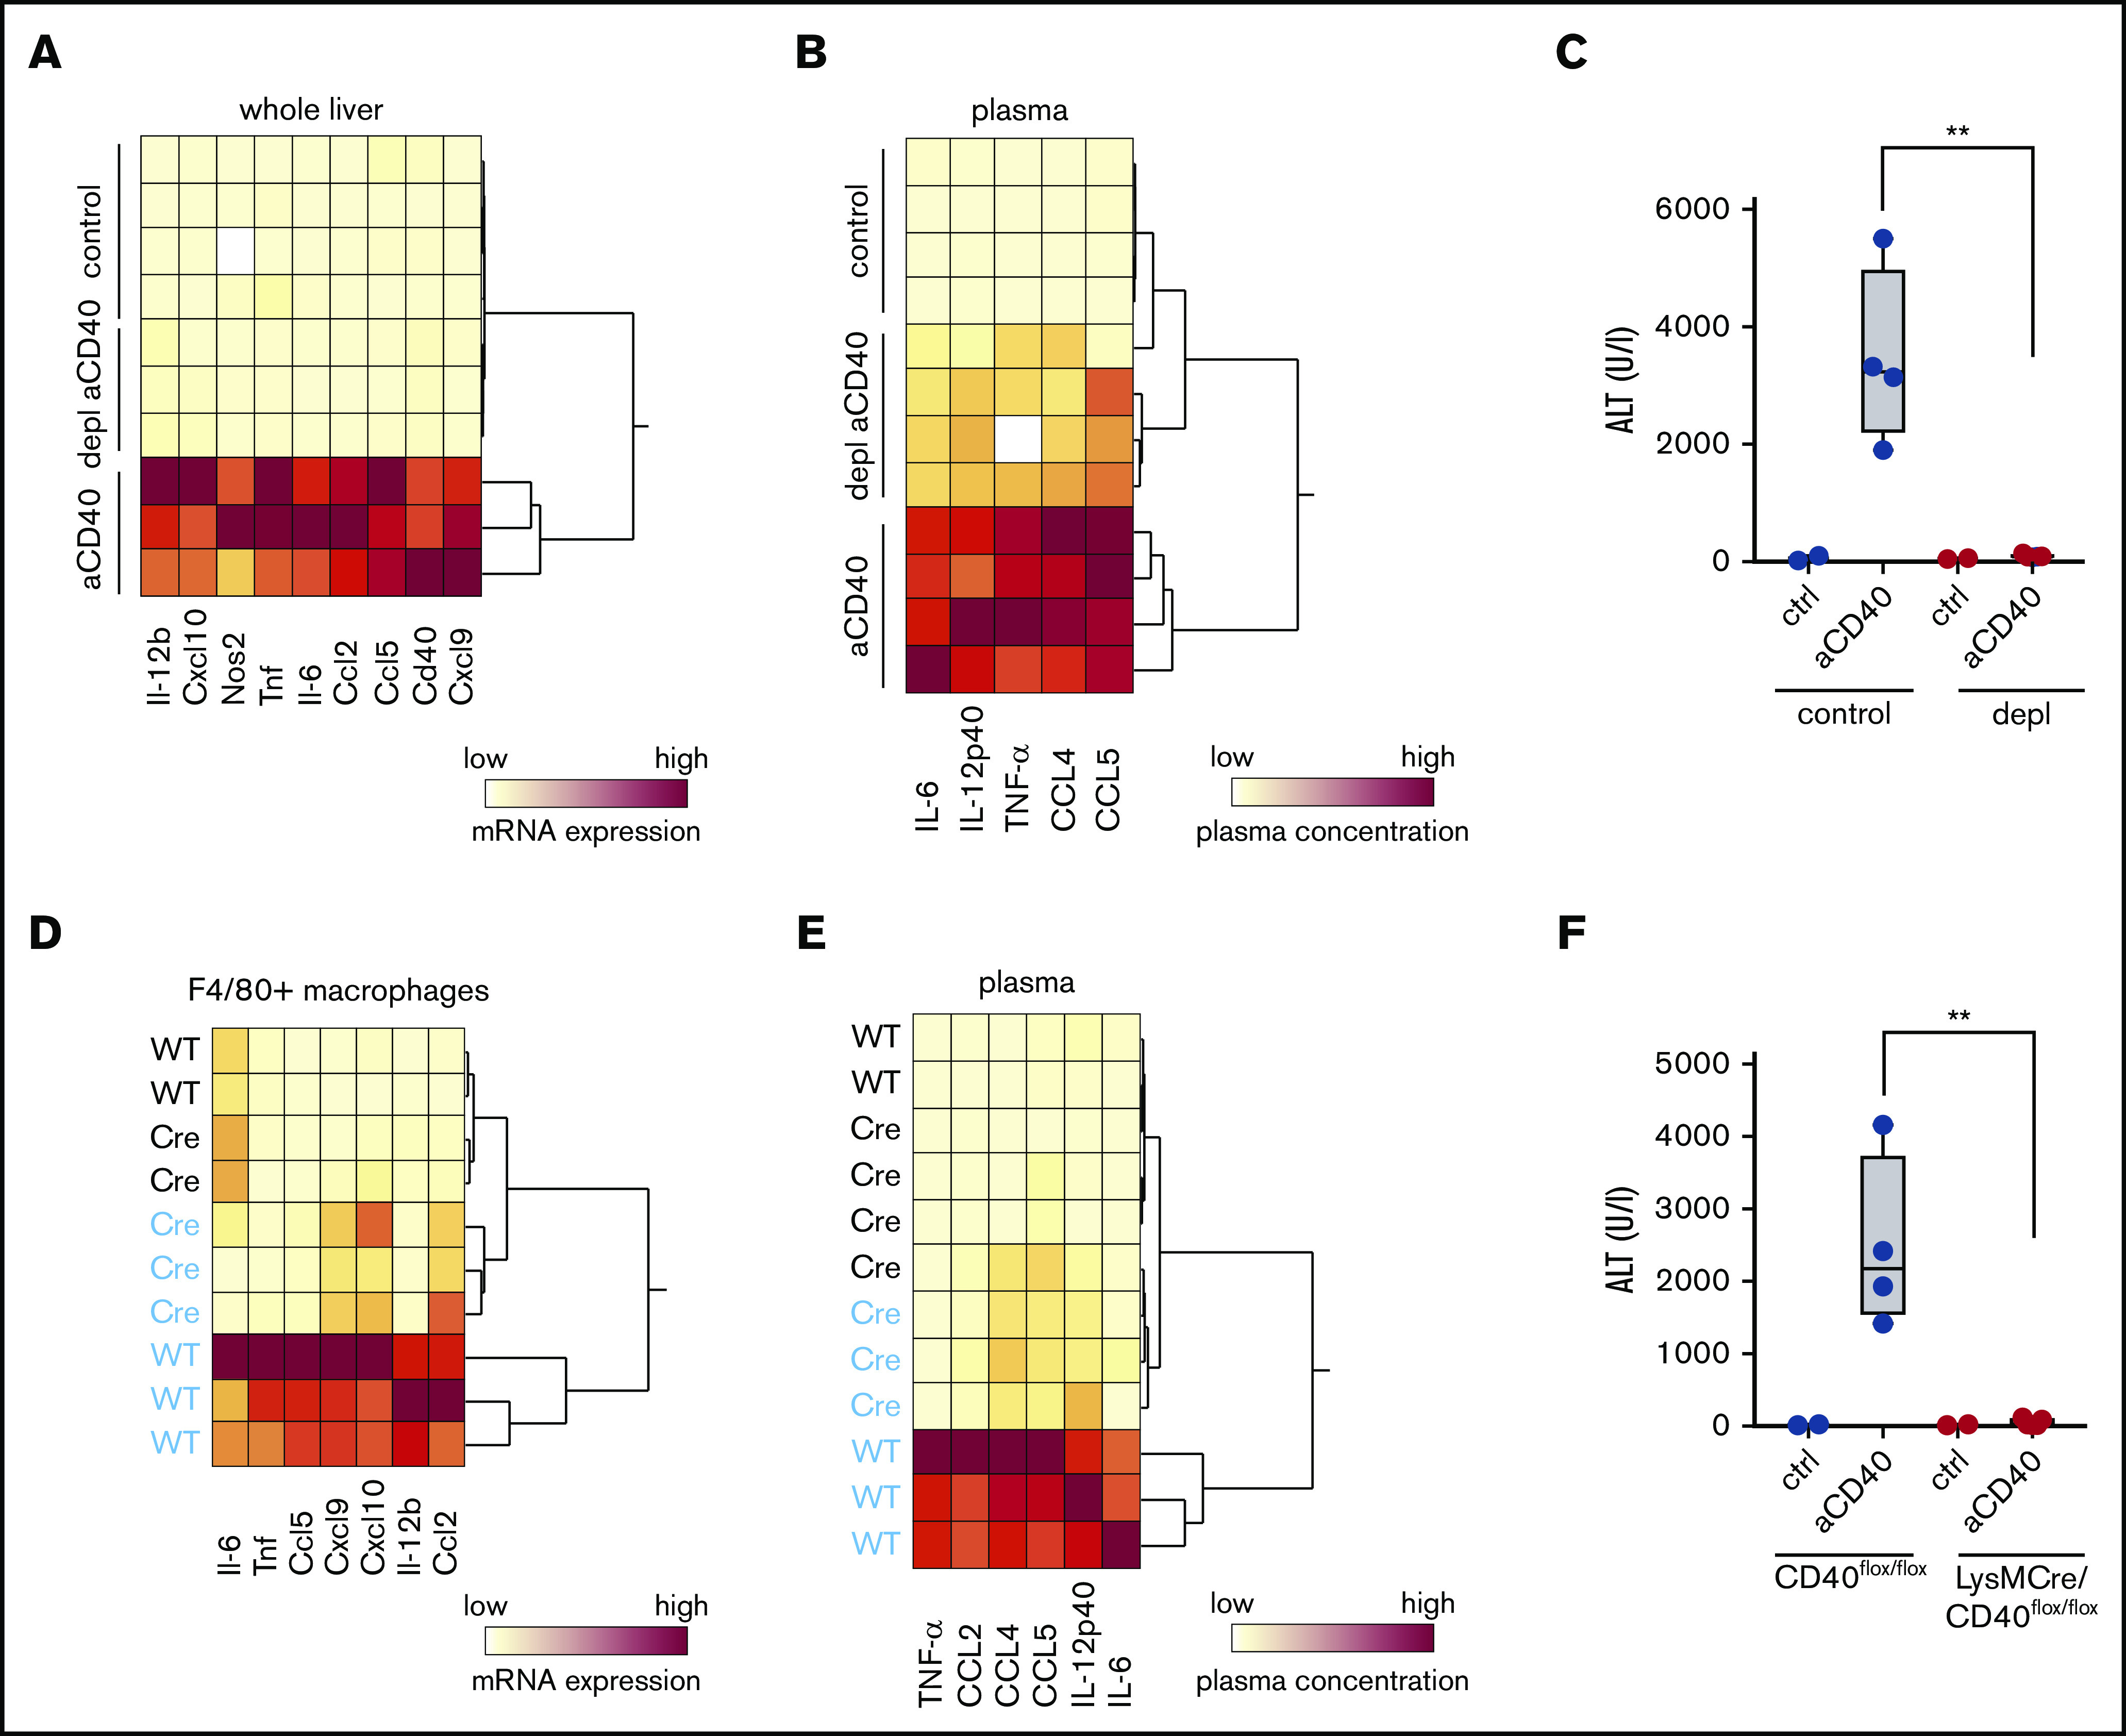
Macrophages as driver of a hemophagocytic syndrome. Mice were treated with anti-CD40 antibody and euthanized 30 hours postinjection. (A) Hierarchical clustering analysis of mRNA expression levels of proinflammatory genes in the whole liver RNA of saline and anti-CD40–treated mice, subjected or not to macrophage depletion. mRNA expression was measured by RT-PCR. Each line identifies an individual saline (control) or anti-CD40–treated animal (yellow, low concentration; red, high concentration). (B) Hierarchical clustering analysis of plasma concentrations of cytokines and chemokines in saline and anti-CD40–ttreated mice, subjected or not to macrophage depletion (yellow, low concentration; red, high concentration). (C) Plasma ALT concentrations in saline (n = 2) or anti-CD40 antibody (n = 4) injected mice, subjected (red dots) or not (black dots) to macrophage depletion. (D) Hierarchical clustering analysis of mRNA expression levels of cytokines and chemokines in F4/80+ isolated liver macrophages from saline (black) and anti-CD40 (blue)-treated CD40flox/flox (wild-type) and LysMCre CD40flox/floxmice. mRNA expression was measured by RT-PCR (yellow, low concentration; red, high concentration). (E) Hierarchical clustering analysis of plasma concentrations of cytokines and chemokines in saline (black) and anti-CD40 (blue)–treated CD40flox/flox (wild-type) and LysMCre CD40flox/flox mice (yellow, low concentration; red, high concentration). (F) Plasma ALT concentrations in saline (n = 2) or anti-CD40–treated CD40flox/flox mice (wild-type, black dots) or LysMCre CD40flox/flox mice (red dots) (n = 4). Individual symbols represent 1 mouse; **P < .01 for all panels.
