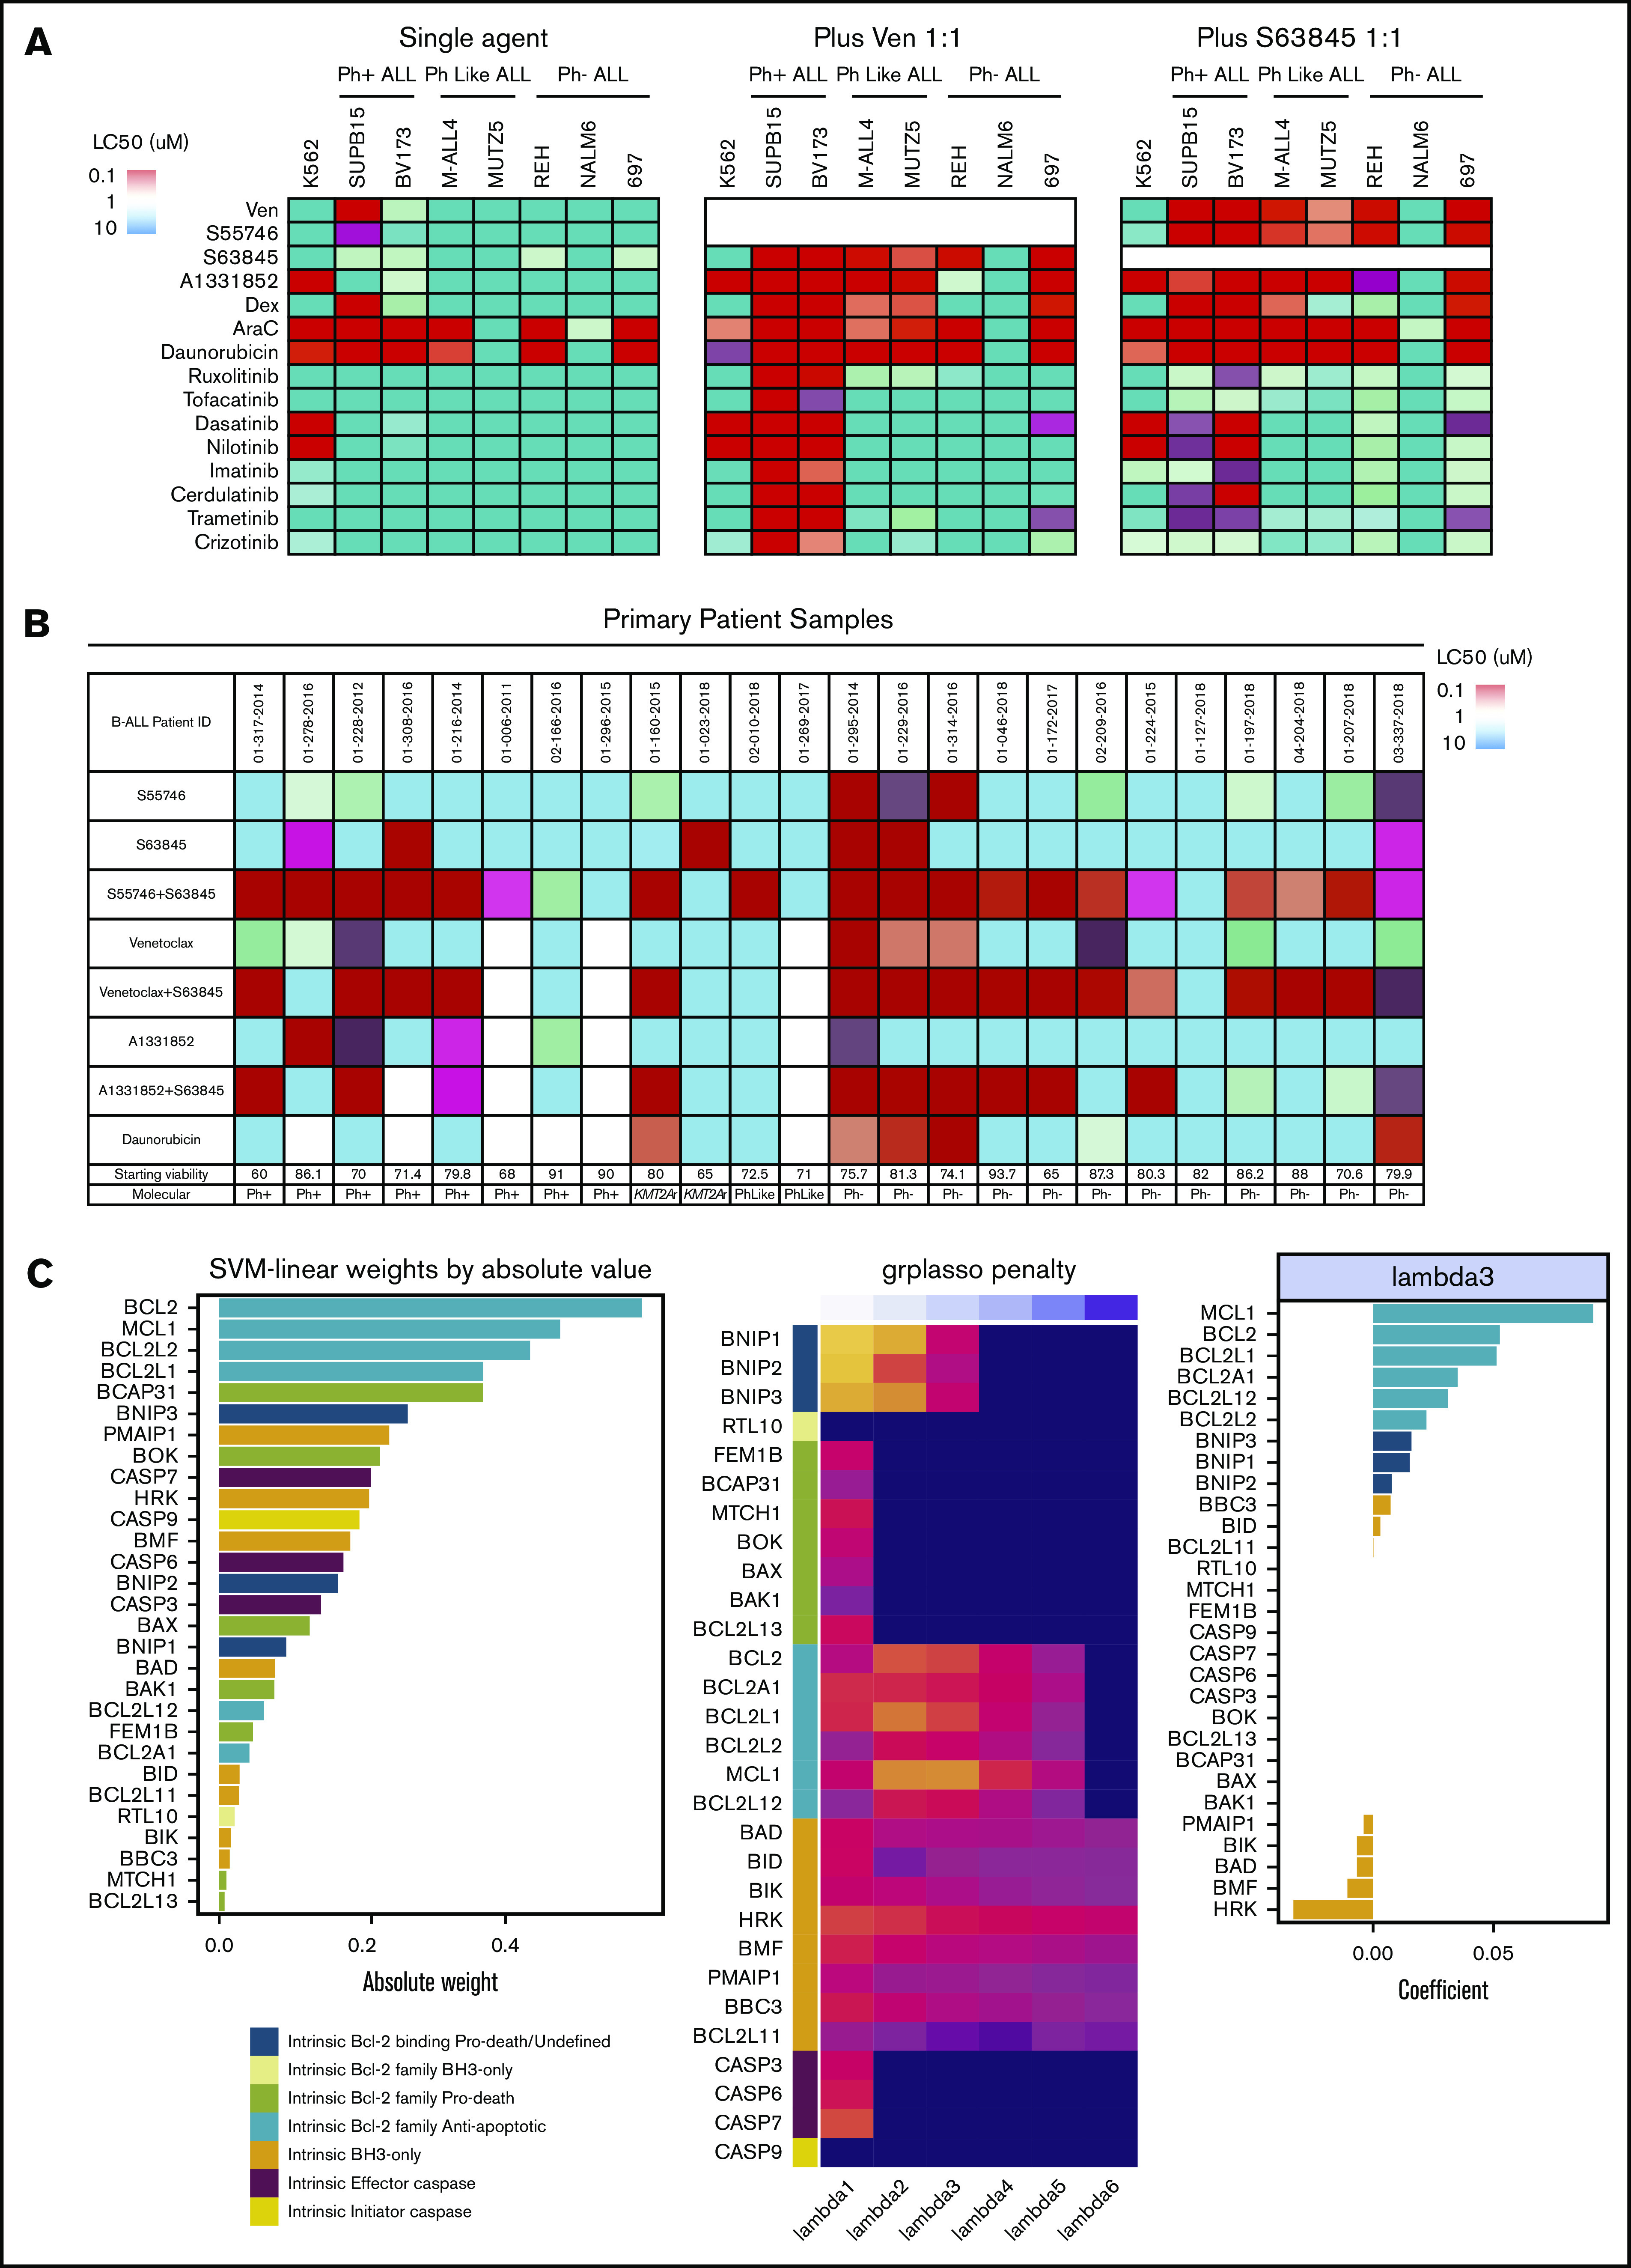
Figure 1.

Interrogating prosurvival protein dependency in vitro in Ph+, Ph-like, and Ph− B-ALL using BH3-mimetic drugs alone and in combination. (A) Heat-map comparison of B-ALL cell-line sensitivity (LC50) to BH3-mimetics, chemotherapy agents, and tyrosine kinase inhibitors as a monotherapy, or in combination (tested in 1:1 ratio) after 48-hour exposure (see also supplemental Figure 1). (B) Heat-map comparison of primary B-ALL sensitivity (LC50) to BH3-mimetic monotherapy, or drug combinations (tested in 1:1 ratio), relative to chemotherapy (daunorubicin) after 48-hour exposure (n = 24). The control cell viability of each B-ALL sample after 48 hours in dimethyl sulfoxide is shown. For panels A and B, a color bar grading the LC50 values for each drug in the heat map is shown. (C) Transcriptional profiling and computational modeling of primary B-ALL patient samples. (left) Absolute weight of BCL-2 and BH3-only gene families in the trained Support Vector Classifier ordered by magnitude with the absolute value representing the importance of the gene to the resistant phenotype (BCL-2+MCL-1 inhibitor LC50 >100 nM). (middle) Heat map of coefficients estimated by the logistic regression model with group lasso penalty. Dark value is 0 coefficient (no importance) with brighter values representing a large coefficient and importance to the resistant phenotype by logistic regression. BCL-2 prosurvival and BH3-only prodeath genes demonstrated the most robust contribution to resistance in the model at the largest values of λ. Coefficients are transformed (absolute values raised to the power of 0.2) to enhance visualization. (right) Original coefficients (for λ = 3) in the linear regression model are given in the bar plot demonstrating directionality of gene expression to the resistant phenotype. The coefficients are positive for the BCL-2 prosurvival family genes, including BCL-2, MCL-1, BCL2L2 (BCL-W), and BCL2L1 (BCL-X), indicating a positive association between the level of expression of these genes with the resistant phenotype, whereas coefficients are negative for the BH3-only proapoptotic family genes HRK, BMF, BAD, BIK, PMAIP1, indicating a negative association between the level of expression of these BH3-only genes and resistance (see supplemental Figure 3). SVM, support vector machine.
