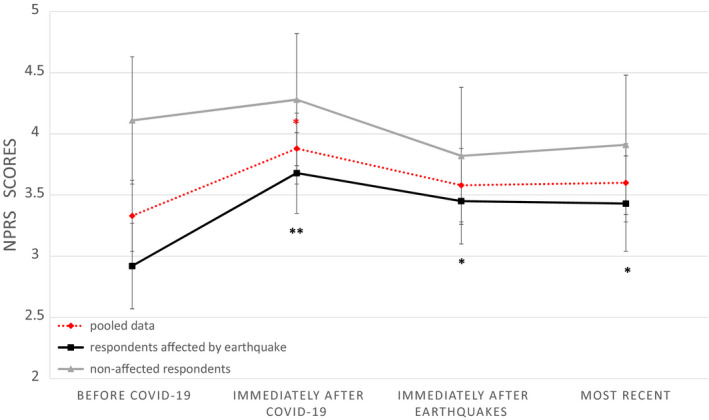
FIGURE 1.

Changes in Numerical pain rating scale (NPRS) from baseline to three control points. NPRS of all respondents ("pooled data") is marked with dotted red line; NPRS of respondents from the areas affected by the earthquakes (respondents from Zagreb) is marked black; NPRS of respondents from non‐affected areas (non‐Zagreb respondents) is marked gray. Whiskers represent standard errors. Asterisk indicates a post hoc significant difference (within‐group comparisons, compared to baseline); *p < .05, **p < .001
