Figure 1.

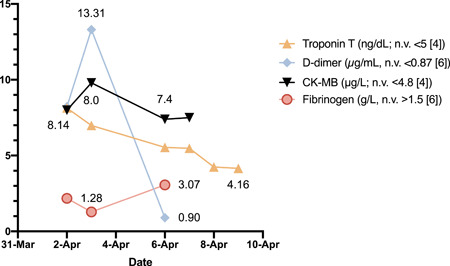
Time course of relevant cardiac and vascular biomarkers. Maximum and minimum values are reported next to the corresponding symbol

Time course of relevant cardiac and vascular biomarkers. Maximum and minimum values are reported next to the corresponding symbol