
Figure 1.
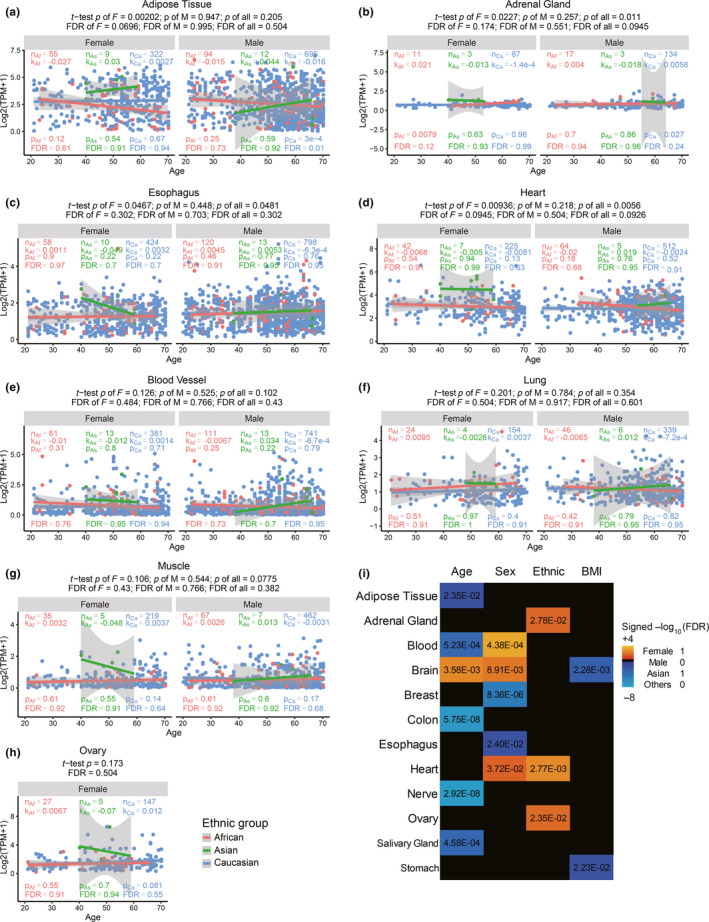
ACE2 expression in different tissues in males, females of Asians, Africans, and Caucasians with age. Panels a–d and e–h are tissues where Asian females show significantly and moderately (marginally significant) higher expression than other groups, respectively. n, sample numbers in each group; k, p, and FDR are slope, p value and multiple testing corrected FDR of linear regression, respectively. The significance p values and FDR of the difference between Asians versus other ethnic groups are shown on top of the graphs. j, Summary statistics of association with each variable while controlling for other variables