
FIGURE 1.
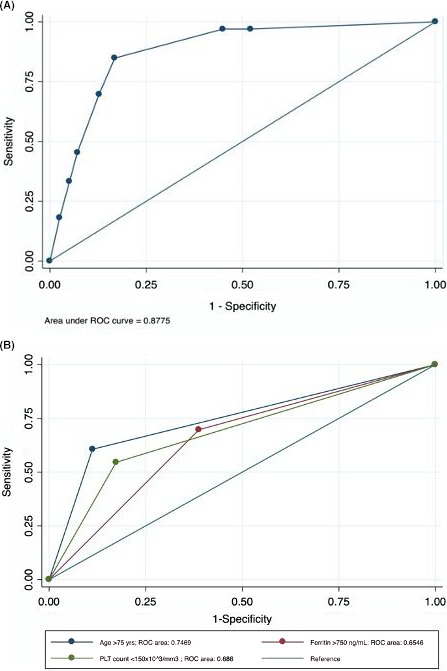
ROC curves for multivariate and univariate analyses. A, Receiver operating characteristic (ROC) curve and corresponding area under the curve (AUC) statistics for the risk score of death with age >75 y; platelets <150 × 103/mm3; ferritin >750 ng/mL. N = 229. B, ROC curve and AUC statistics for age >75 y (n = 42); platelets < 150×103/mm3 (n = 52); ferritin > 750 ng/mL (n = 99)