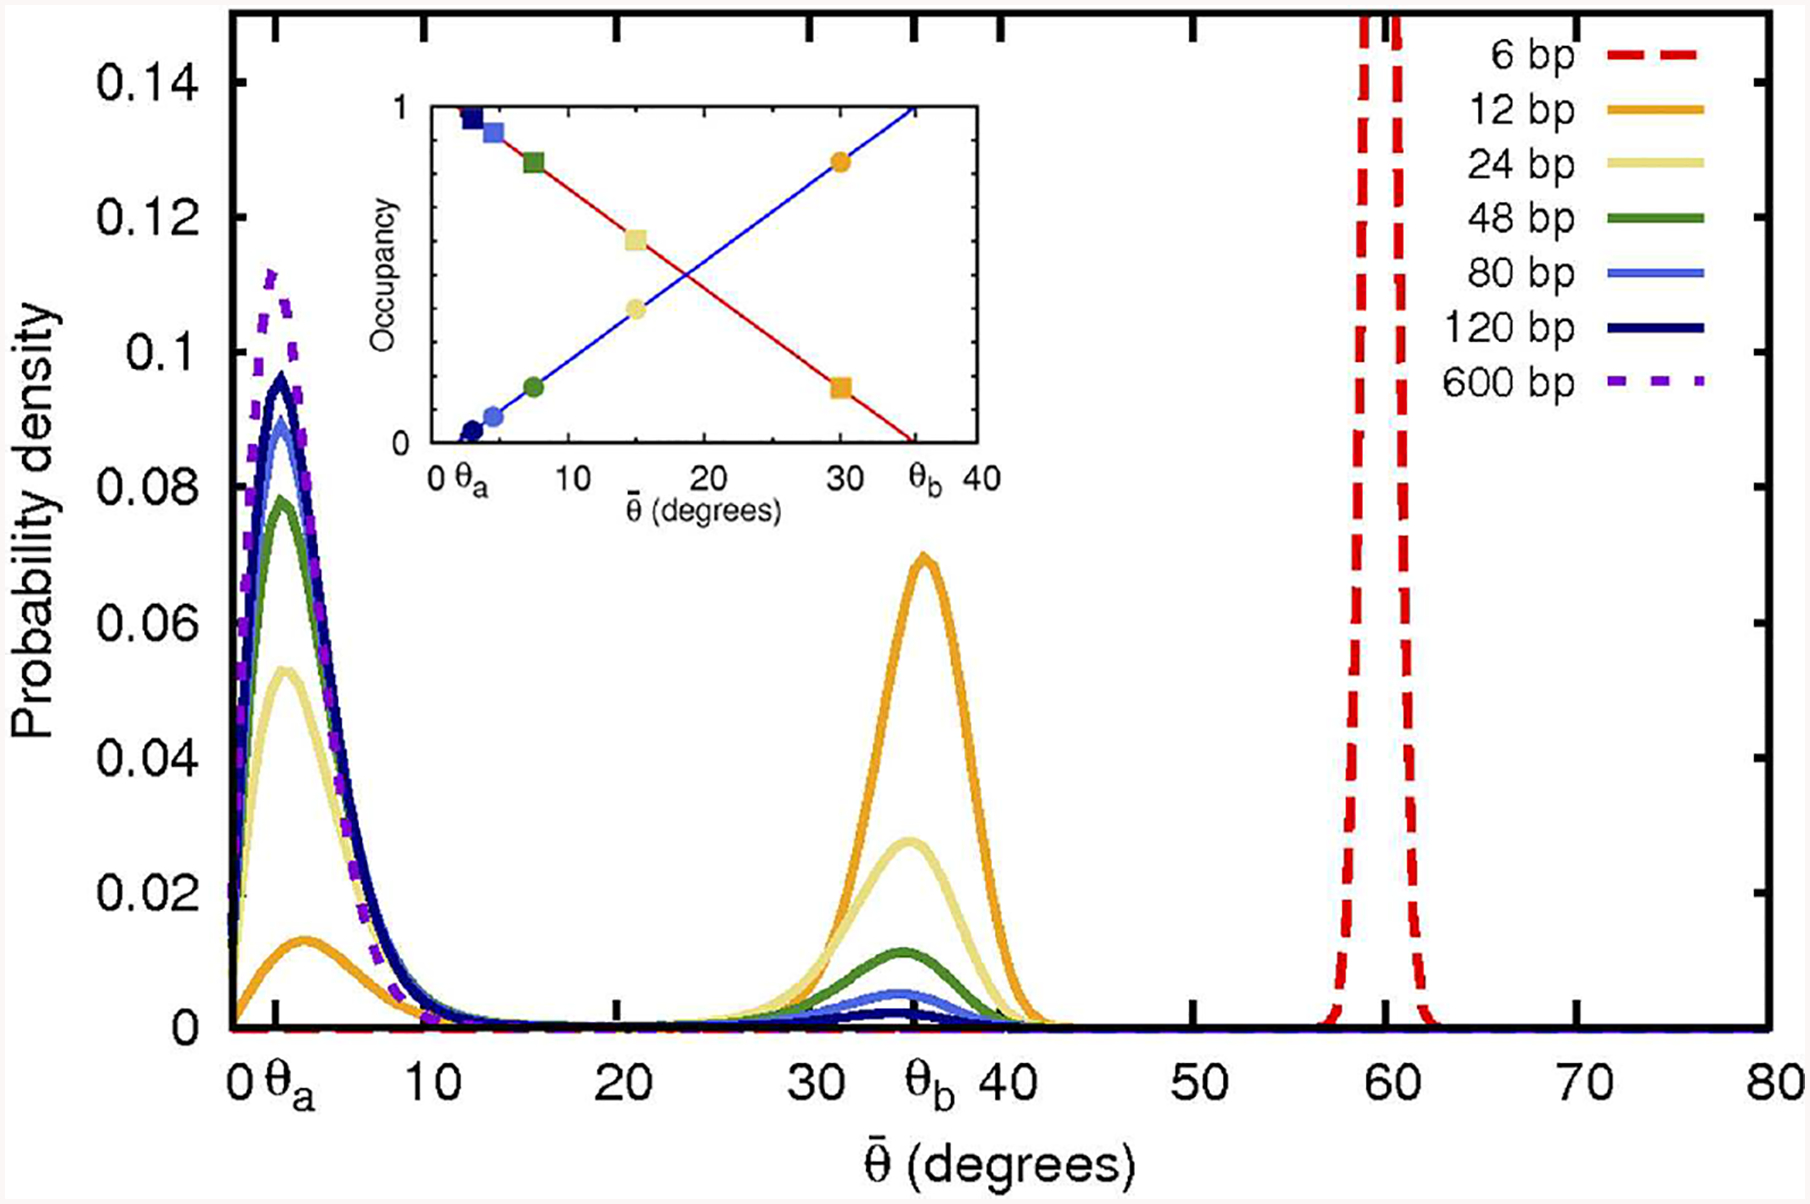
FIGURE 2 |.

Non-convex bending energy function leads to bi-modal distribution of bending angles. Shown are angular probability distributions at 300 K resulting from a realistic non-convex bending potential (Figure 4) used here in coarse-grained simulations of DNA closed loops of variable size. As the loop size (indicated in the top right corner) decreases, the average bending angle per base pair increases. When the average angle falls into the convex hull range, the angular distribution becomes bi-modal with peaks at θa and θb, corresponding to the weakly and strongly bent states, respectively. Fractional occupancy of both of these states of bending is shown in the inset as a function of the average bend angle . Squares: occupancy of the weakly bent state. Circles: occupancy of the strongly bent state, which can be interpreted as a “kink.” Out-of-plane motion likely affects angular probability distribution of the largest (600 bp) loop, which may explain the shift, compared to expectation, of the position of the corresponding distribution peak.
