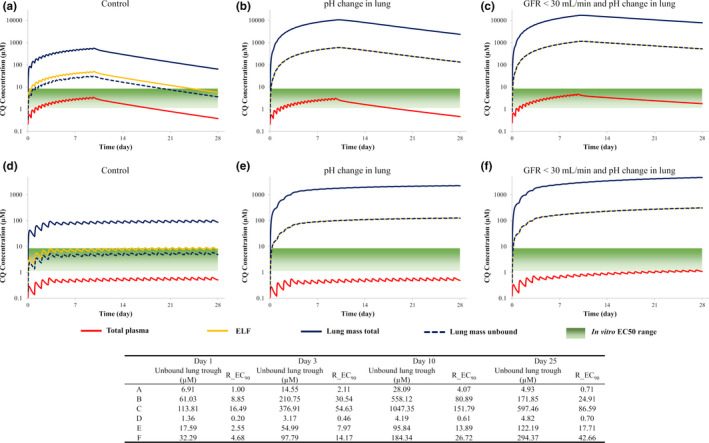
Figure 3.

The effect of a reduction in lung pH and renal impairment on the plasma and lung exposure of chloroquine (CQ) relative to in vitro half‐maximal effective concentration (EC50) values for two dosing regimens. (a–c) There was 600 mg b.i.d. administered for 10 days (ClinicalTrials.gov Identifier: NCT04323527); (d–f) 300 mg q.d. for 4 days, followed by 150 mg q.d. (ClinicalTrials.gov Identifier: NCT04333732).Total plasma (red line), lung mass total (blue solid line), lung mass unbound (blue dashed line), epithelial lining fluid (ELF; yellow line) are shown. R_EC90: Ratio of the simulated lung mass unbound concentration to effective concentration 90% (EC90) value (6.9 µM) against severe acute respiratory syndrome‐coronavirus 2 virus in Vero E6 cells. GFR, glomerular filtration rate.
