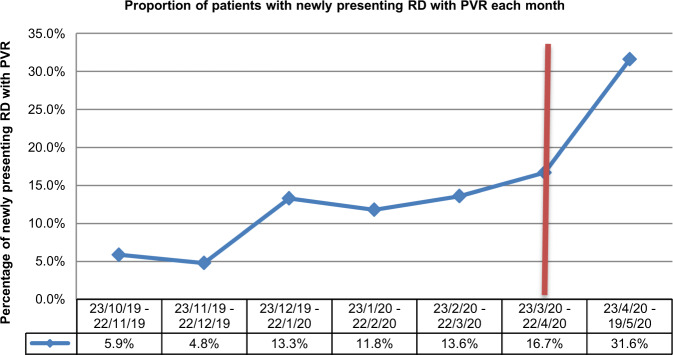
Fig. 1. Line chart showing the percentage of newly presenting rhegmatogenous retinal detachments that have proliferative vitreoretinopathy (blue line).
Data are plotted for each month, covering the period of study between 23/10/19 until 19/5/20. The vertical red line indicates the time point at which the United Kingdom lockdown was officially announced (23/3/20). Following this date, a spike in the prevalence of proliferative vitreoretinopathy is clearly seen among newly presenting retinal detachments, p = 0.0471.

