
Figure 2.
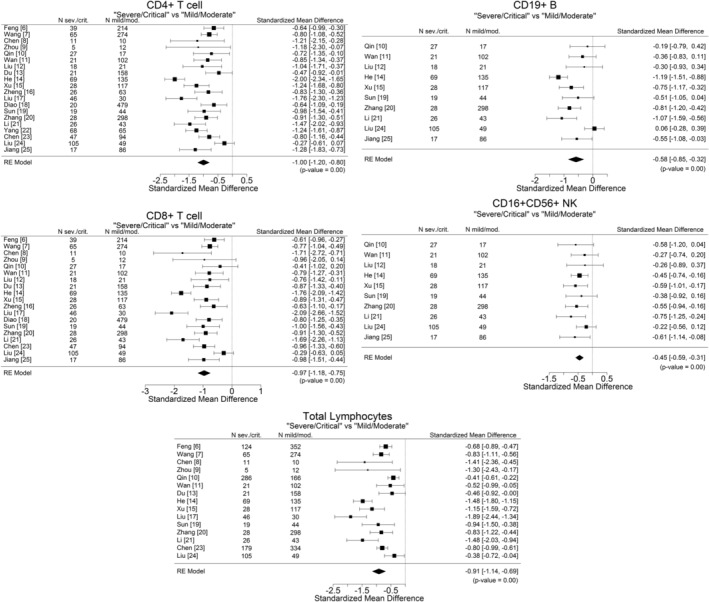
Standardized mean differences (SMDs) between mild/moderate and severe/critical disease groups, with 95% confidence interval (95%CI), in COVID‐19 patients. There is one panel for total lymphocytes, as well as panels for each subset. SMDs with CI results on the left of the 0 vertical line indicate a negative difference, i.e., the average mean count in the severe/critical group was significantly lower than in the mild/moderate group. Note that the width of the individual CIs is a function of sample size and reported variability within each publication.