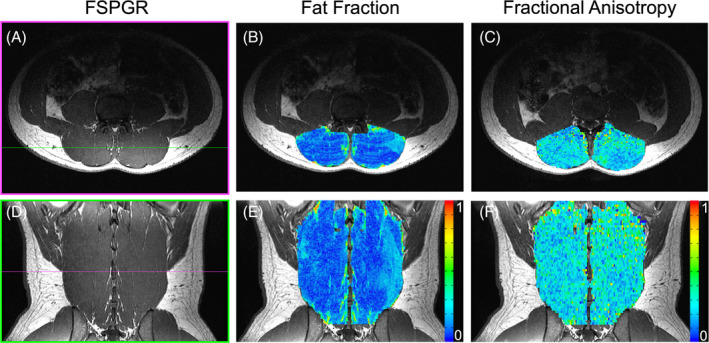
Figure 2.

Representative axial (top) and coronal reformatted (bottom) MRIs of the high resolution FSPGR scan (A,D), fat fraction map (B,E), and fractional anisotropy map (C,F) at the L3. The bands of signal in the axial fat fraction map (B) are due to a breathing artifact
