Figure 2.

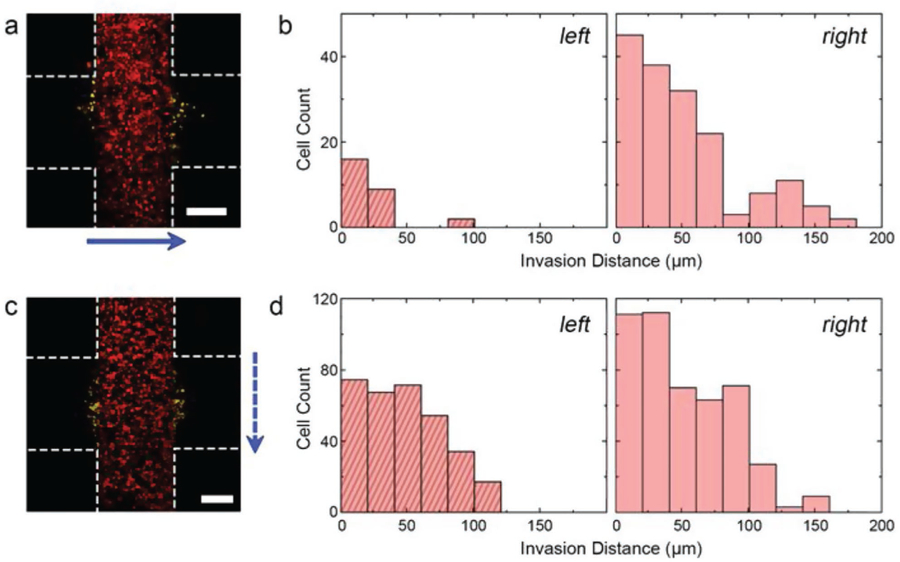
Interstitial flow effects a) maximum projection confocal micrograph of HCT-116 cells after 10 days of continuous flow (4 µL min−1). Blue arrow indicates direction of flow. Construct borders are roughly indicated by white dashed lines (inter-region border not indicated for clarity) and positions of invading cells (i.e., cells entering the cell-free region) are shaded yellow. b) Histograms of distances traveled into the left and right cell-free regions of (a), relative to the respective inter-region borders. c) Maximum projection confocal micrograph of HCT-116 cells after 10 days of intermittent flow (4 µL min−1 for 10 min, no flow for 120 min). Blue arrow shows direction of flow and other indicators match those found in (a). d) Histograms of distances traveled into the left and right cell-free regions of (c), relative to the respective inter-region borders. Scale bars are 300 µm. See also Figure S1, Supporting Information.
