
Figure 5.
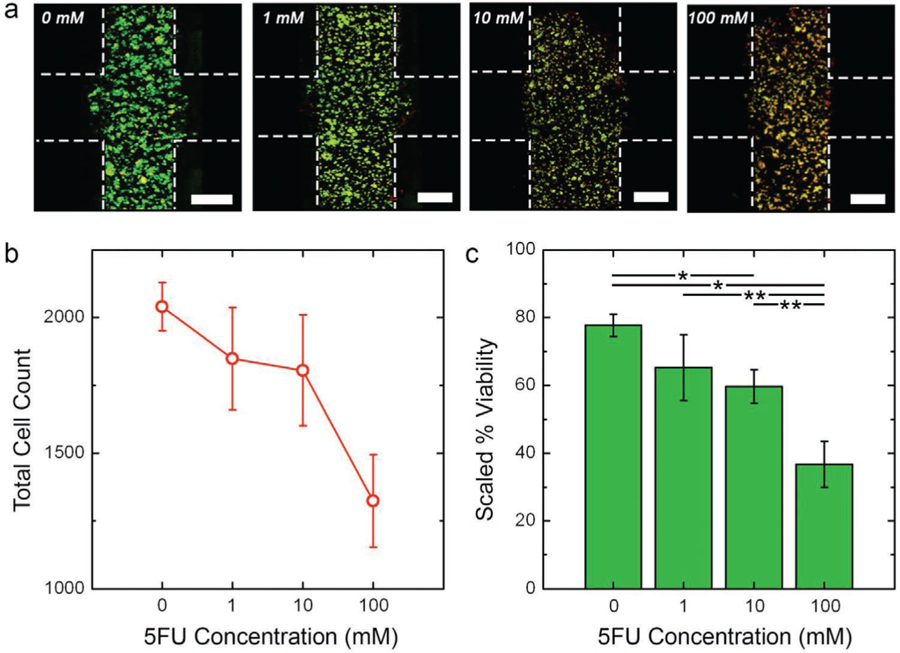
HCT-116 viability under 5FU insult. a) Maximum projection L/D confocal micrographs of HCT-116 cells after 10 days intermittent flow of indicated 5FU concentration. Green cells are live and red cells are dead. Construct borders are roughly indicated by white dashed lines (inter-region border not indicated for clarity) and scale bars are 300 µm. b) Total cell count (live plus dead) on day ten, indicating the net loss of cells as a function of 5FU concentration. c) Scaled viability on day 10 calculated as the ratio of live cells under a given condition to total number of cells in the control (0 mm) construct. This value accounts for dead cell decomposition during the long-term measurement. Significance: *p < 0.01, **p < 0.05.