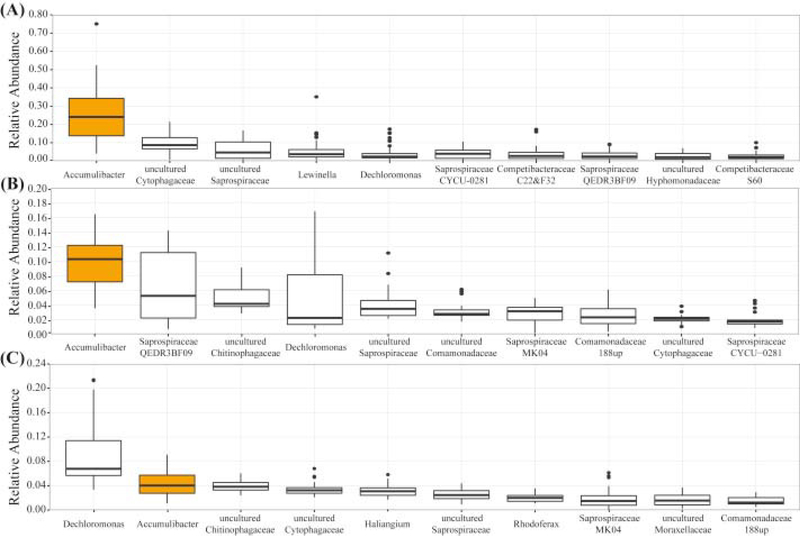
Fig. 5.
Phylogenetic abundance variation box plot at the genus level of the most abundant taxonomic units retrieved (A) lab-scale, (B) pilot-scale SBR and (C) Nine Springs, based on 16S rRNA gene tag sequencing data presented as the relative abundance. Results correspond to the taxonomic distribution of 45 samples from the lab-scale SBR, 23 samples from the pilot-scale SBR and 38 samples from the full-scale WWTP Nine Springs. The name of each genus-level taxon in this figure correspond to the one proposed in the MIDAS database (Mielczarek et al., 2013).

