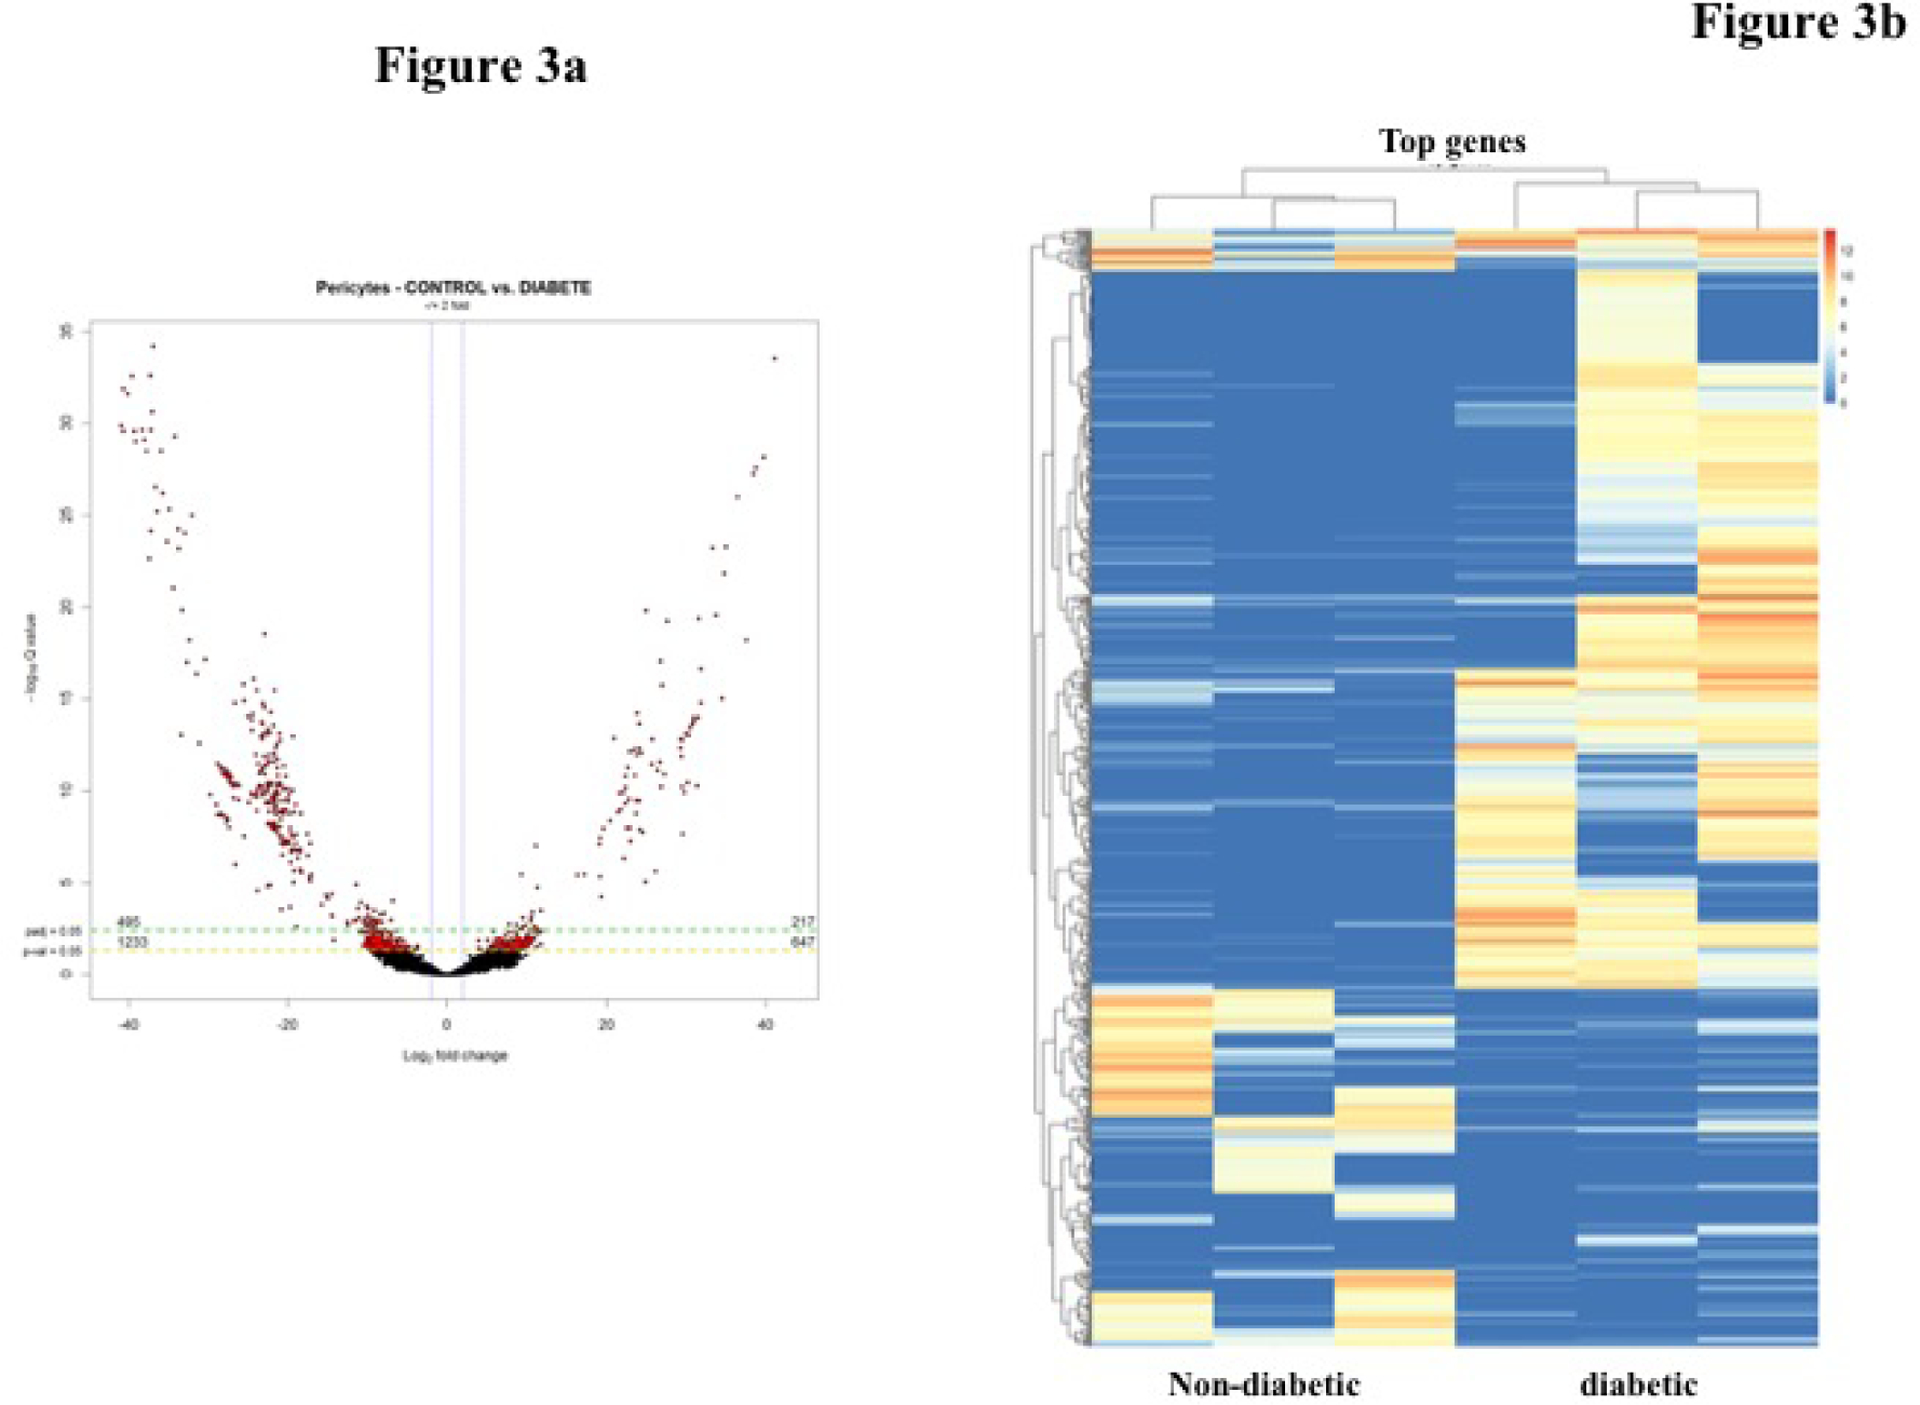
Figure 3.

a) Volcano plot of fold change (FC) of transcripts derived using edgeR. Diabetic pericytes compared to control pericytes. Significantly upregulated genes (217) are in the right side and down regulated genes (495) in the left indicated in red circles. b) Hierarchically clustered heatmap showing transcripts of pericytes from non-diabetic and diabetic mice (n=3).
