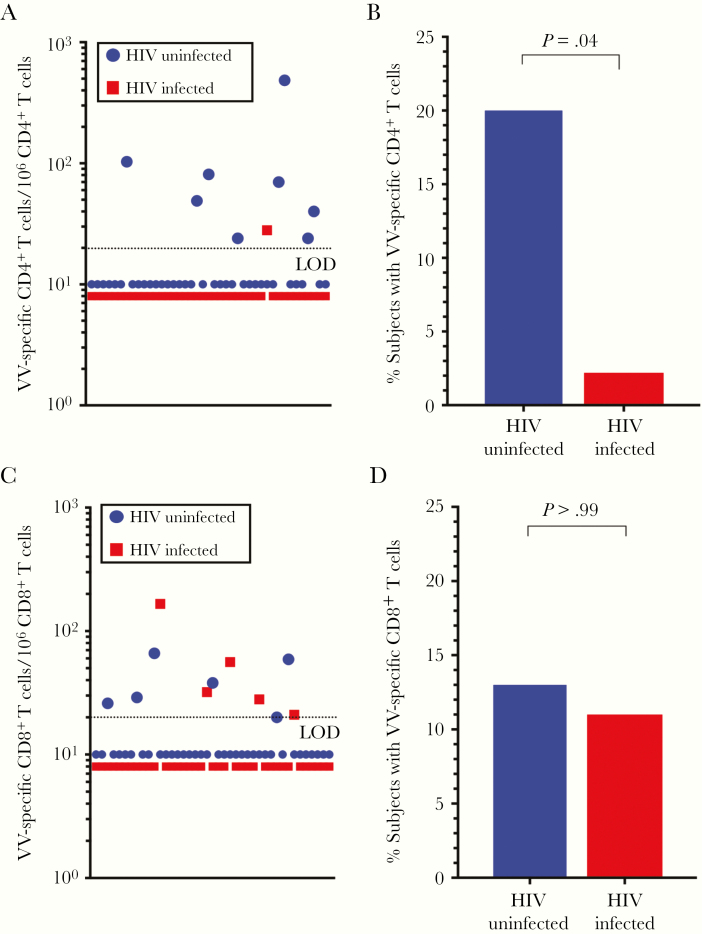
Figure 2.
Quantitation of vaccinia virus (VV)–specific CD4+ and CD8+ T-cell memory. A, B, The quantitation of VV-specific CD4+ T cells (A) and the percentage of human immunodeficiency virus (HIV)–infected and HIV-uninfected participants with detectable VV-specific CD4+ memory T cells (B) were determined after direct ex vivo stimulation with VV. C, D, The frequency of VV-specific CD8+ T-cell responses (C) and the percentage of HIV-infected and HIV-uninfected participants with detectable VV-specific CD8+ T cells (D) were determined after stimulation with VV in the same assays. A frequency of ≥20 virus-specific interferon γ + tumor necrosis factor α + T cells per million T cells is considered a positive antiviral T-cell response. P values were determined using the exact McNemar test. Abbreviation: LOD; limit of detection.

