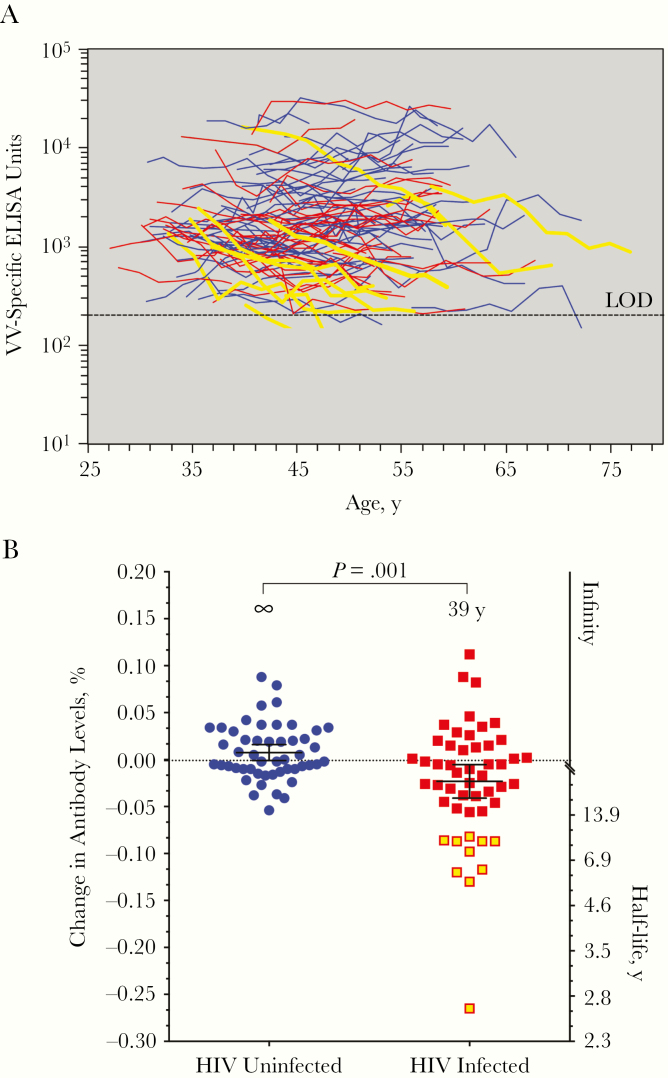
Figure 3.
Longitudinal analysis of vaccinia virus (VV)–specific antibody responses. A, Longitudinal antibody responses of individual human immunodeficiency virus (HIV)–infected participants (red or yellow lines) and HIV-uninfected participants (blue lines) as a function of age. The dashed line indicates the limit of detection (LOD; 200 enzyme-linked immunosorbent assay [ELISA] units) and values below the LOD are considered equivocal and excluded from analysis. B, Estimated half-life of VV-specific antibody responses based on the individual slopes of each longitudinal antibody response. These values were calculated using the least squares method to show the overall distribution of VV-specific antibody decay rates (percentage change in antibody levels). The mean estimated antibody half-life of each group is shown with error bars representing 95% confidence intervals, and statistical comparisons between groups were determined using a longitudinal mixed-effects model. A mean of 9 serum samples per HIV-infected participant and a mean of 9 serum samples per HIV-uninfected participant were examined over a median period of 17.4 to 17.8 years of time for HIV-infected and HIV-uninfected participants, respectively. Two HIV-infected participants became VV seronegative so quickly that there were not ≥3 data points above the LOD (the minimum for accurate half-life determinations); therefore, their data is presented here graphically but was excluded from the overall group antibody half-life estimation and statistical comparisons. The HIV-infected individuals with the most rapid loss of virus-specific antibodies are shown as yellow lines (A) or yellow-filled symbols (B).

