Figure 2.

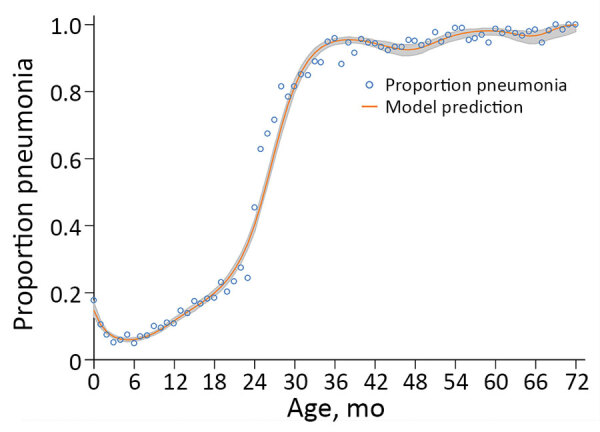
Proportion of bronchiolitis and pneumonia admissions for pneumonia-related codes as contrasted with model predictions by age, Singapore, 2005–2013. Gray shading along the curve indicates 95% CI.

Proportion of bronchiolitis and pneumonia admissions for pneumonia-related codes as contrasted with model predictions by age, Singapore, 2005–2013. Gray shading along the curve indicates 95% CI.