
Figure 5.
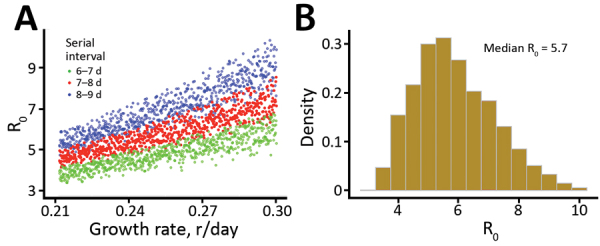
Estimation of the basic reproductive number (R0), derived by integrating uncertainties in parameter values, during the coronavirus disease outbreak in China. A) Changes in R0 based on different growth rates and serial intervals. Each dot represents a calculation with mean latent period (range 2.2–6 days) and mean infectious periods (range 4–14 days). Only those estimates falling within the range of serial intervals of interests were plotted. B) Histogram summarizing the estimated R0 of all dots in panel A (i.e., serial interval ranges of 6–9 days). The median R0 is 5.7 (95% CI 3.8–8.9).