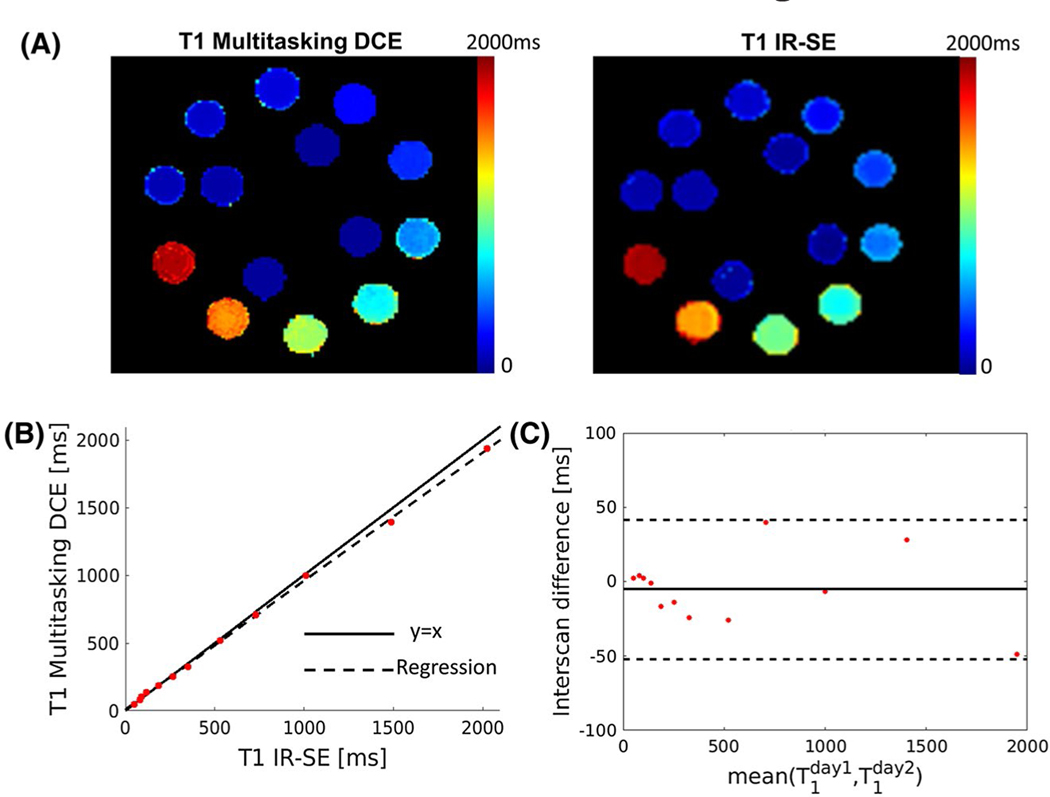
FIGURE 1.
Phantom measurements. (A) T1 maps from the Multitasking DCE and reference inversion-recovery spin-echo (IR-SE) sequence of the T1 layer of ISMRM/NIST MRI system phantom. (B) Regression of T1 of the proposed Multitasking DCE versus IR-SE. The solid line represents y = x, whereas the dashed lines represent the regression of the T1 from 2 methods (R2 = 0.970). (C) The Bland–Altman plot shows intersession repeatability of the T1 measurement of the Multitasking DCE measured on 2 different days. The solid line and dashed lines indicate the mean value and 1.96 of the SD of the T1 between different measurements, respectively

