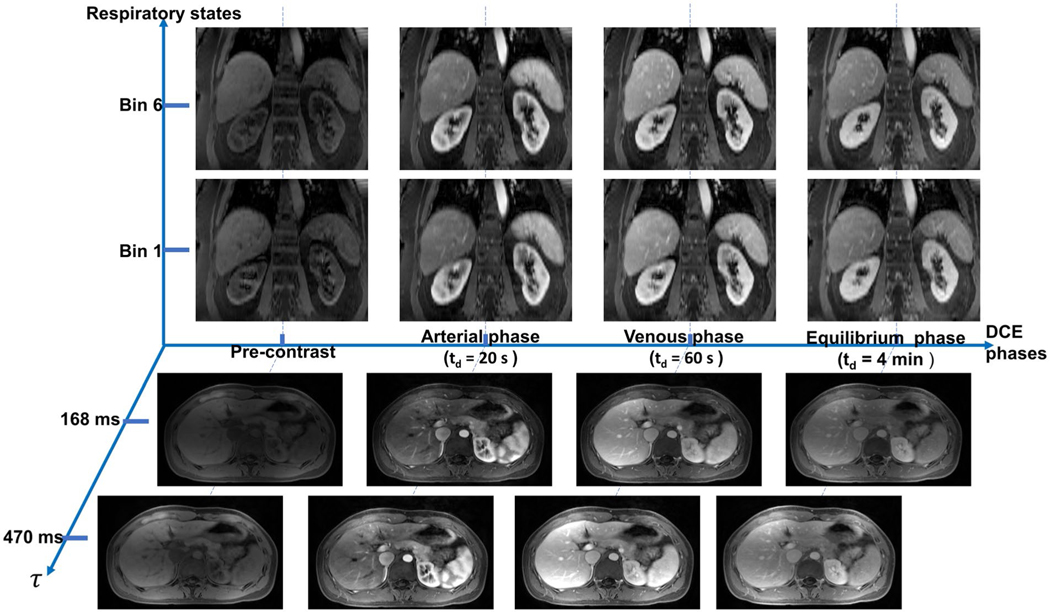
FIGURE 3.
Representative 6D images with 3 spatial dimensions, a saturation-recovery (SR) dimension, a respiratory dimension, and a DCE time course. Images are displayed at pre-contrast phase, arterial phase (td = 20 seconds), venous phase (td = 60 seconds), and equilibrium phase (td = 4 minutes). For each DCE phase, images of end-inspiration (bin 1) and end-expiration (bin 6) phases at τ = 470 ms are shown in coronal orientation; images of different τs (τ = 168 ms and τ = 470 ms) at end-expiration phase are shown in transversal view with clear pancreas delineation

