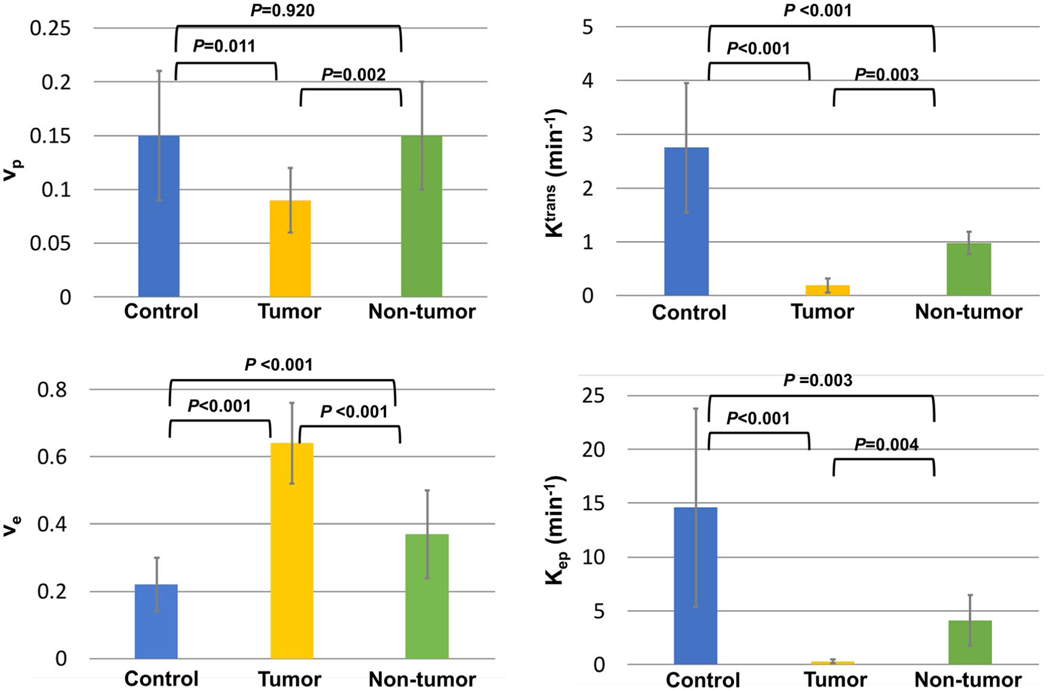
FIGURE 7.
Bar graph showing the mean value and SD of vp, Ktrans, ve, and Kep for control group, tumor, and nontumoral regions in the patient group. The p-values between each pair of categories by one-way unbalanced ANOVA with Holm-Bonferroni correction are marked on top of the bar graph. All 4 parameters were significantly different in the comparison between tumor and control and between tumor and non-tumor. The Ktrans, ve, and Kep between control and non-tumor also showed a significant difference

