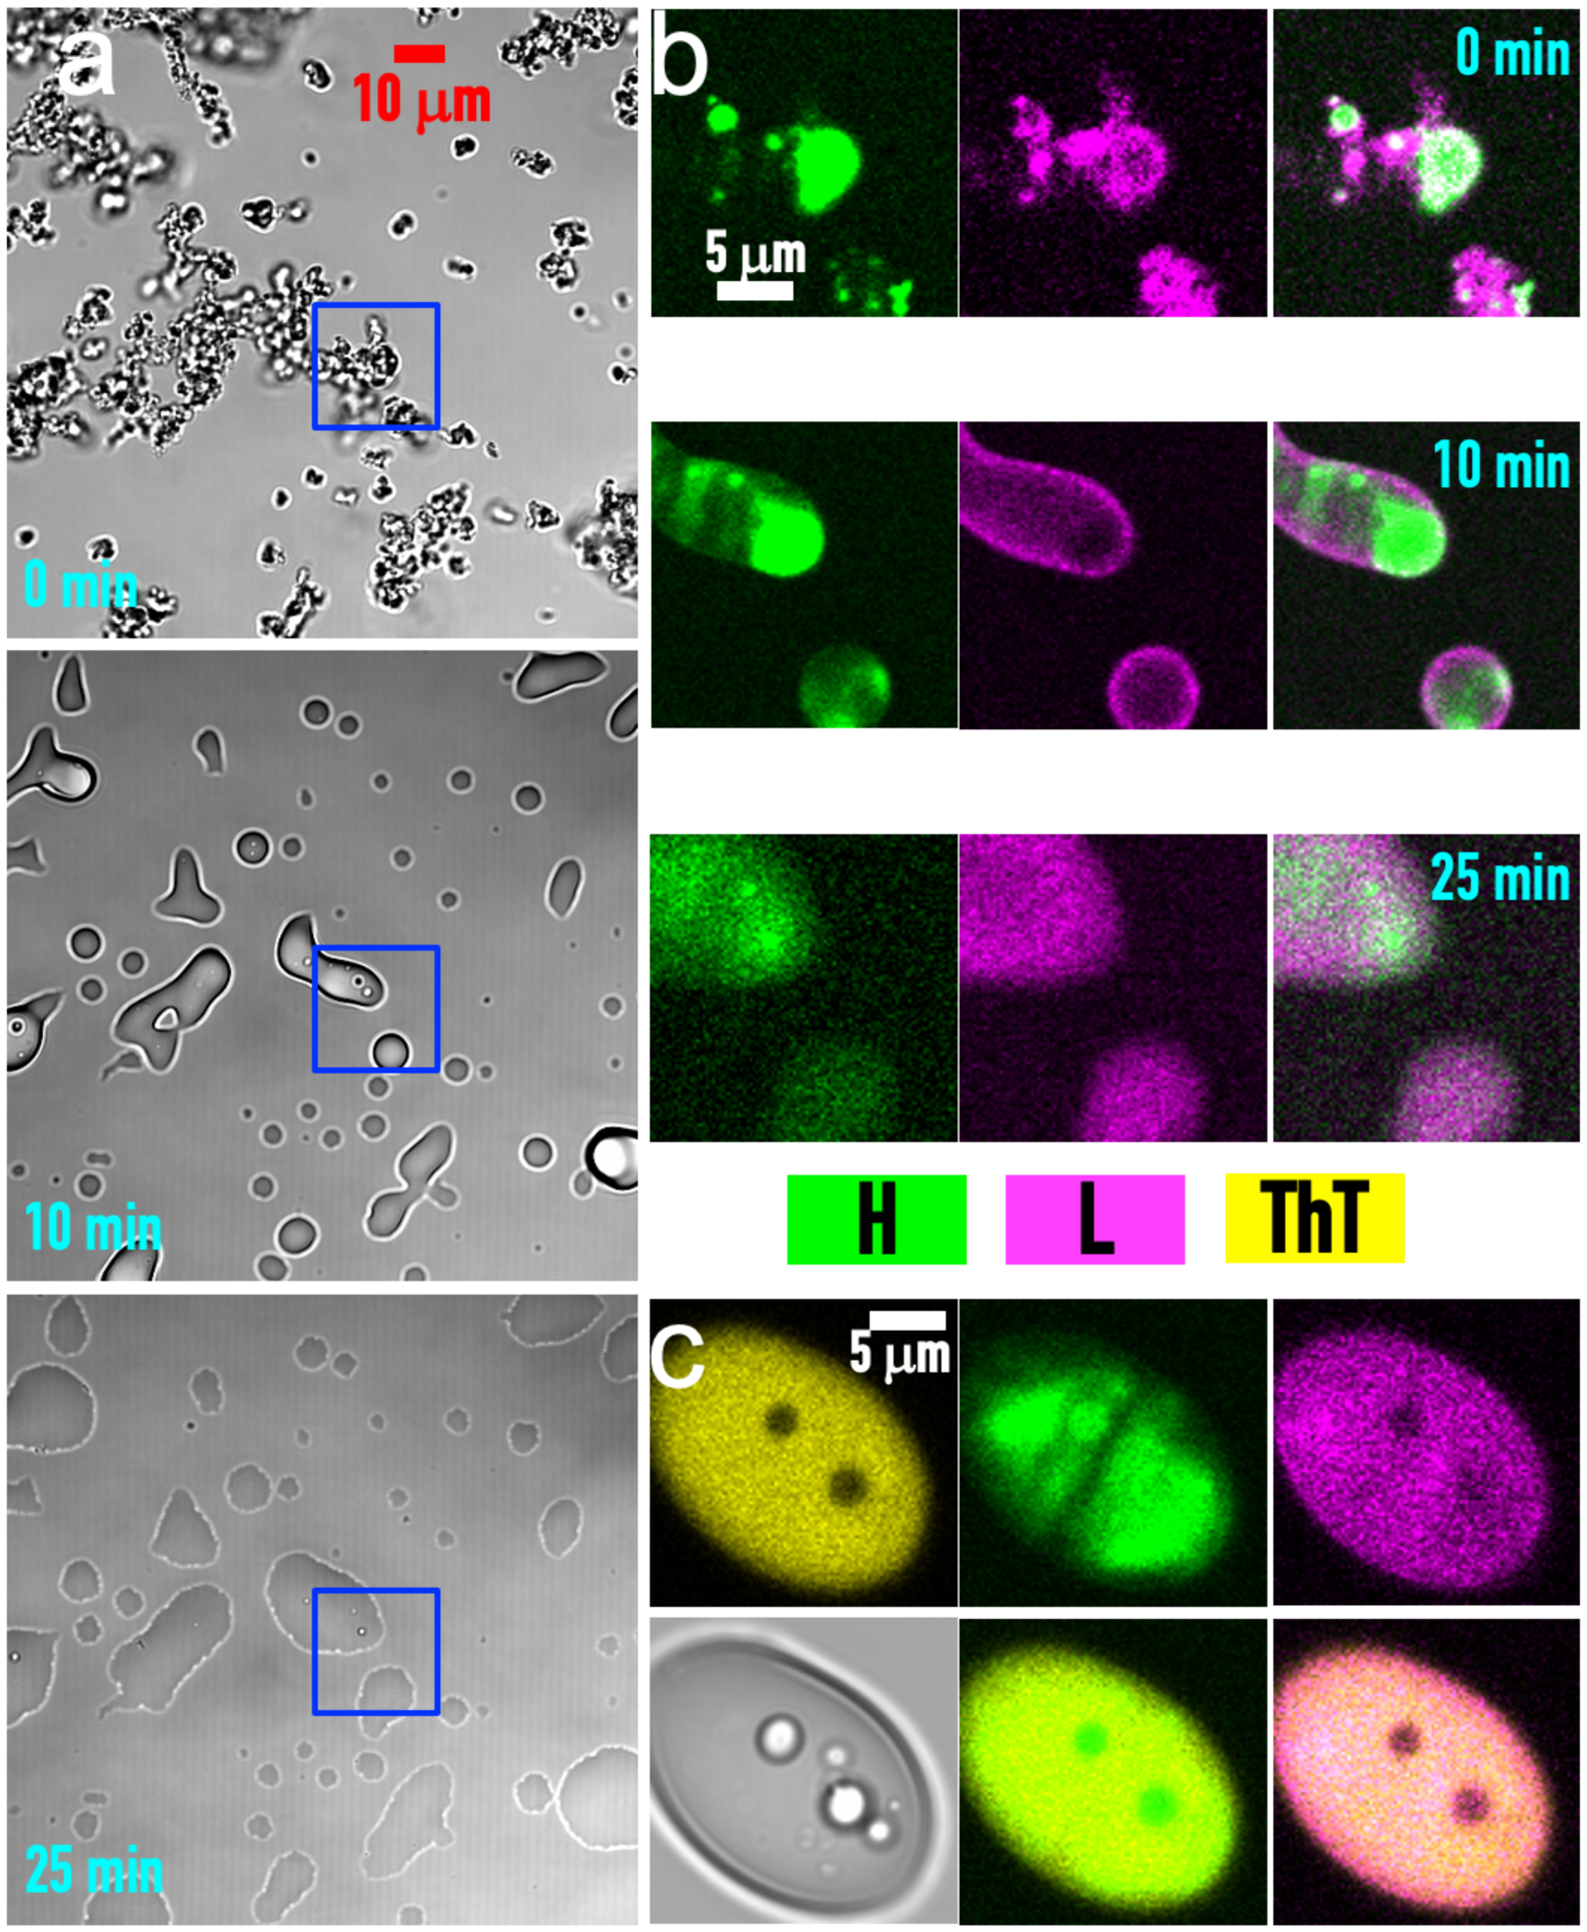
Figure 4. Evolution of P:H:L condensates over time.

(a) Brightfield images of a P:H:L mixture (10:40:150 μM) at t = 0, 10 and 25 min. The region in a blue box is enlarged and shown in (b) by fluorescence of FITC-heparin (green) and Cy5-lysozyme (magenta). The merge of the green and magenta channels clearly shows demixing of H and L in the condensates at t = 0 and 10 min: FITC-heparin is concentrated in places where Cy5-lysozyme is deficient. At t = 25 min, mixing of H and L occurs but is still incomplete. (c) ThT binding to a P:H:L condensate at t = 5 min after mixing (10:40:150 μM). Top row: images recorded in yellow (ThT), green (FITC-heparin), and magenta (Cy5-lysozyme) channels. Bottom row: brightfield image and merges of the yellow channel with either the green or magenta channel. Within the condensate are two droplets enriched in FITC-heparin but deficient in Cy5-lysozyme and showing poor ThT binding.
