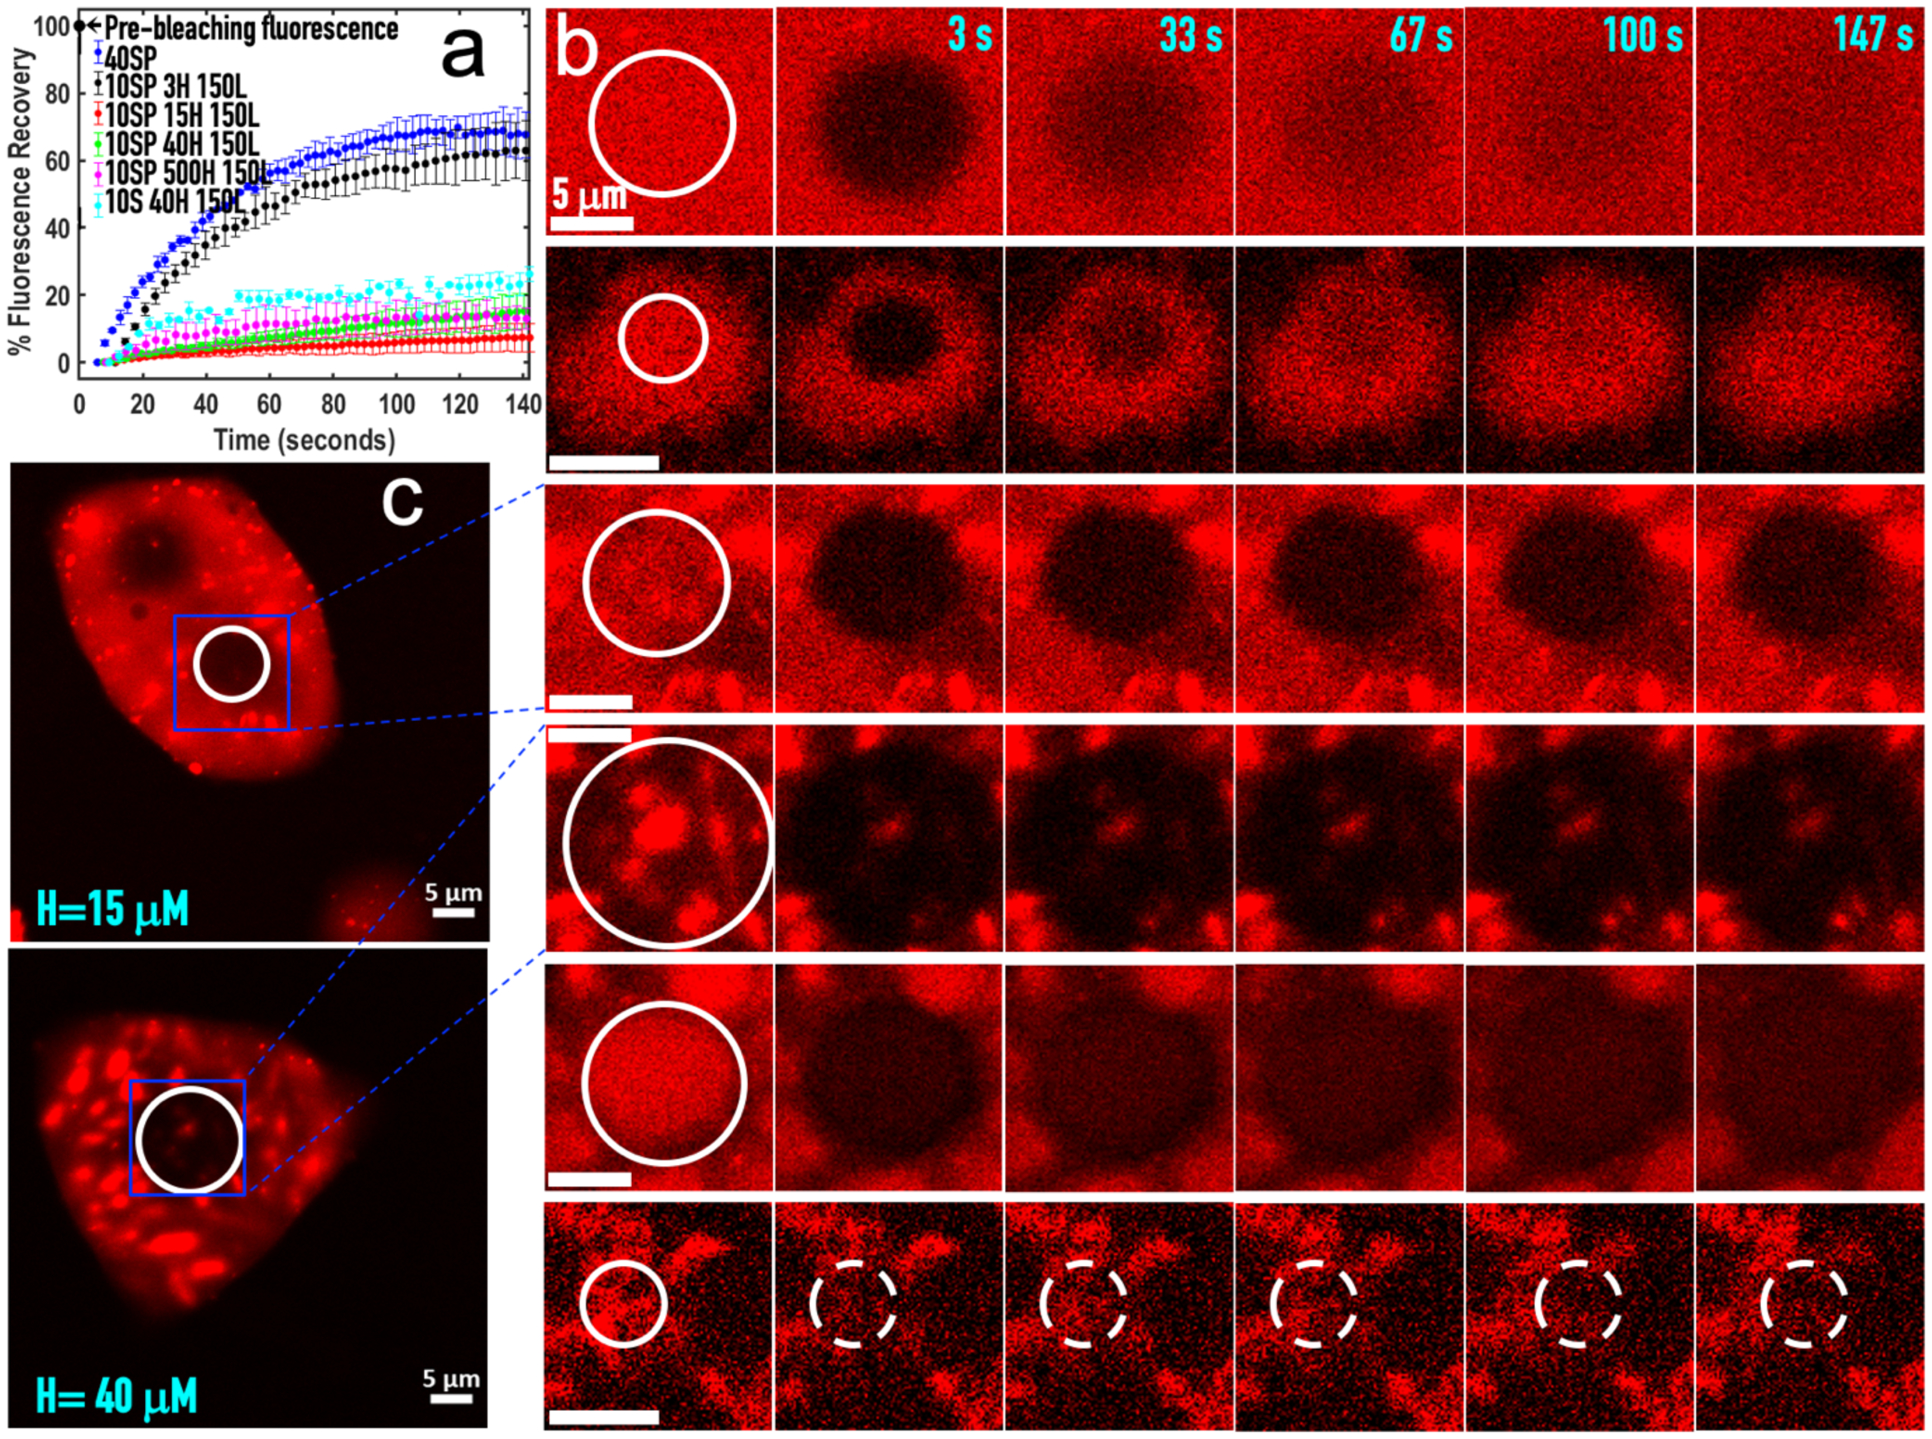
Figure 7. Fluorescence recovery after photobleaching (FRAP) of binary, ternary, and quaternary mixtures.

(a) Time dependences of the percentages of fluorescence intensity recovered in different condensates. The condensates were formed by mixing species at concentrations (in μM) shown in the legend, and had settled over a coverslip. (b) Fluorescence images before bleaching and at indicated times after bleaching. White circles indicate bleached regions. From top to bottom: S:P, S:P:H:L at H = 3, 15, 40, and 500 μM, and S:H:L. (c) Post-FRAP images of two S:P:H:L mixtures over a larger field containing the cropped regions shown in (b). The image at H = 15 μM was taken 10 min after bleaching of the circled region, still showing no recovery. To the upper left is another spot where FRAP was done even earlier, by 5 min. The image at H = 40 μM was taken immediately after completion of FRAP in the circled region.
