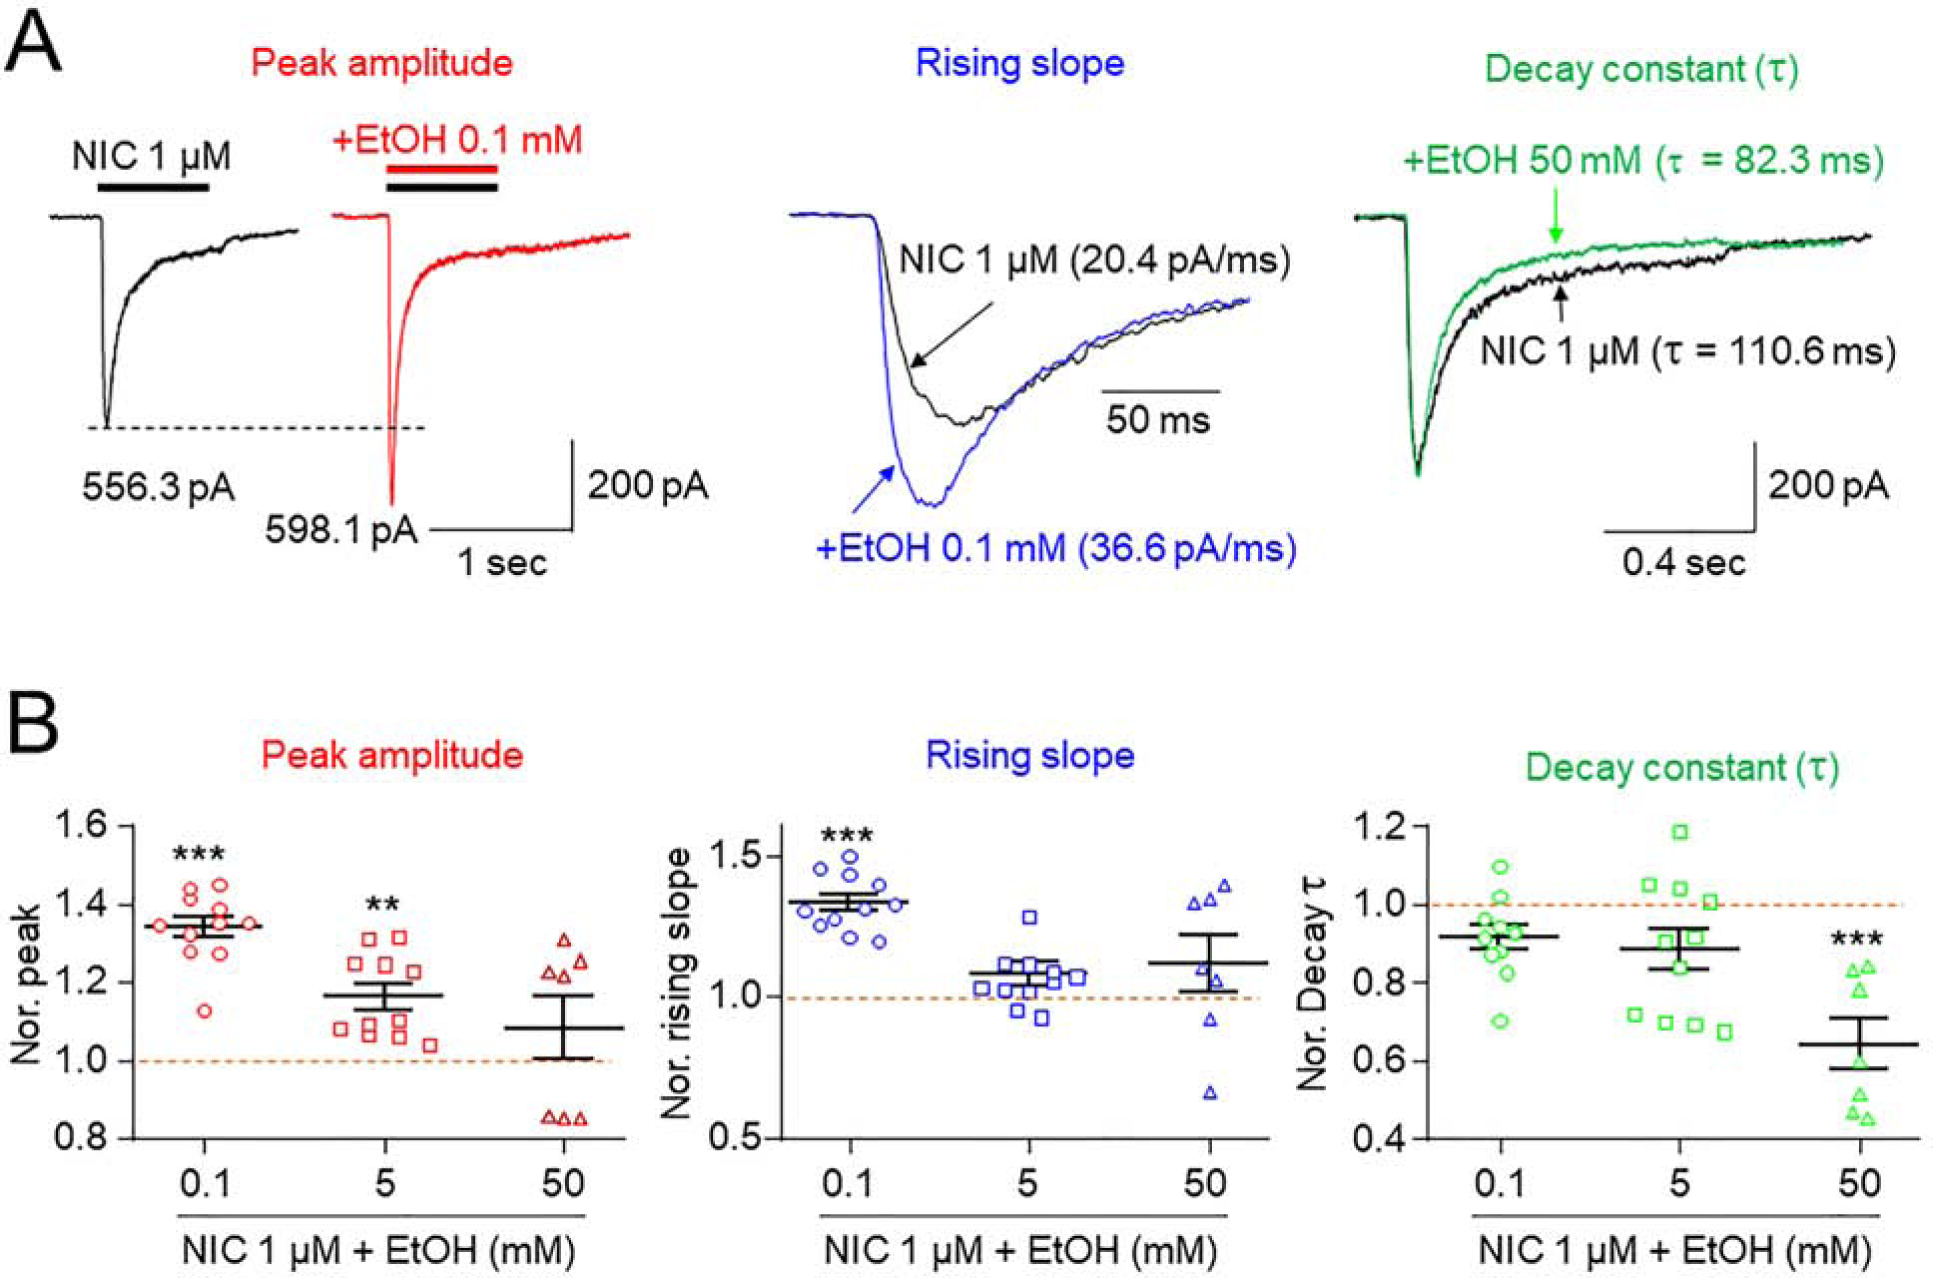
Fig. 3. Effects of EtOH on whole-cell current kinetics of NIC-induced currents.

A: Comparison of the effects of 0.1 mM EtOH on peak amplitudes, current rising times and current decay times of 1 μM NIC-induced currents. NIC-induced currents before and during EtOH exposure are superimposed in middle panel. Right panel compared effects of 1 μM NIC-induced currents decay constant with (green trace) and without (black trace) 50 mM EtOH. B: Summary of pooled data to compare alterations of peak currents, rising times and decay times of NIC-induced currents during exposure to different concentrations of EtOH. * indicates p<0.05, ** indicates p<0.01, and *** indicates p<0.001.
