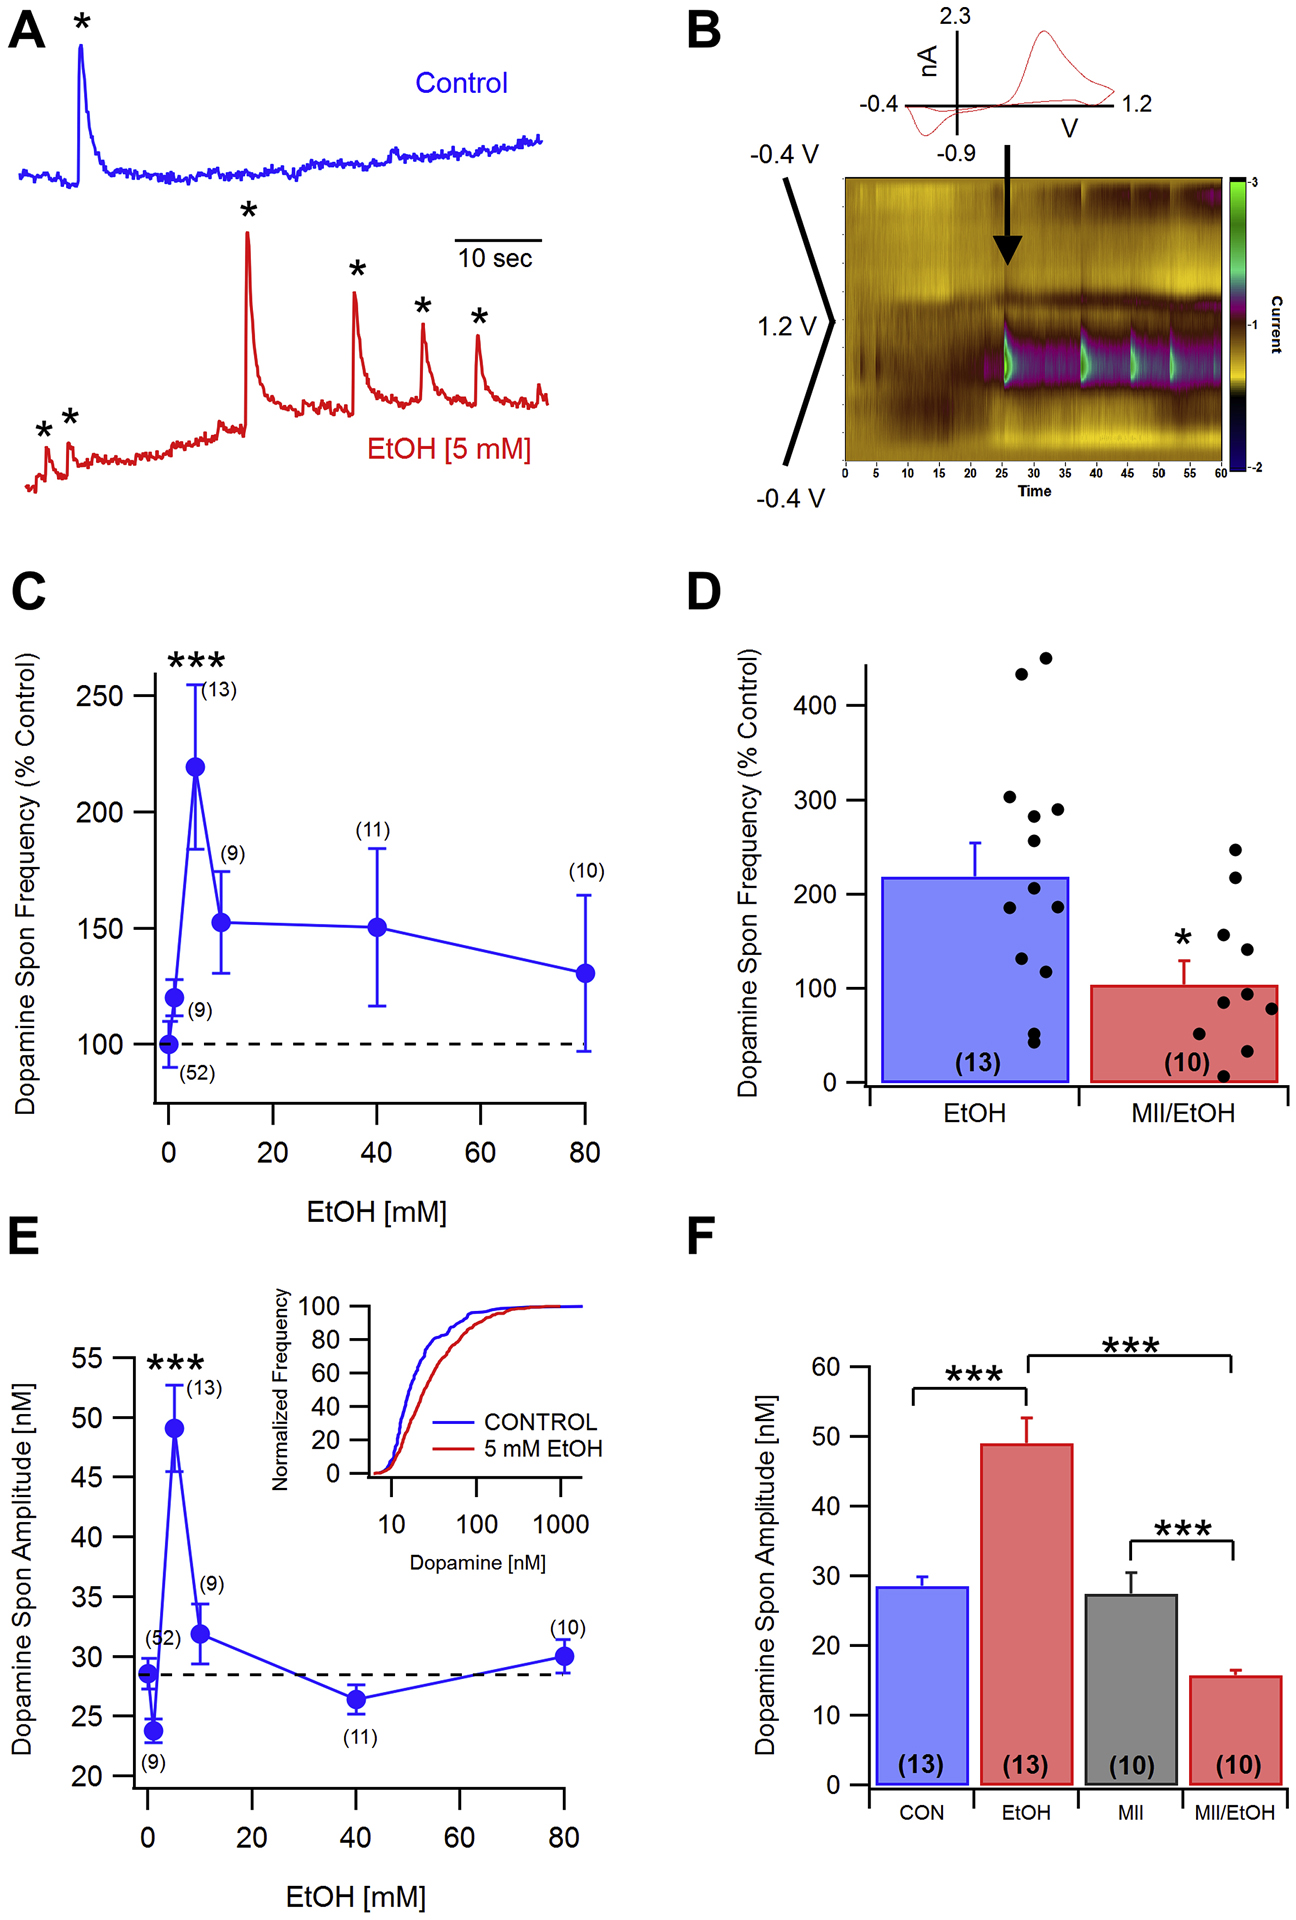
Fig. 6. Effects of low-dose EtOH on spontaneous DA release in the NAc core: Role of α6-nAChRs.

A: Representative 1 min recordings of DA transients under control (top) and 5 mM EtOH (bottom) conditions. Asterisks denote currents corresponding to spontaneous DA release. B: The inset shows a cyclic voltammogram taken at the time indicated by the arrow. Voltammograms were recorded at 10 Hz with a voltage ramp from −0.4 V to 1.2 V to −0.4 V. The color plot shows the DA signal associated with the DA transients in (A, bottom trace). C: Dose-response for EtOH (1–80 mM) effects on DA transient frequency. Ethanol significantly enhanced the frequency of DA transients at the 5 mM concentration. D: Comparisons of exposure to EtOH or to α-conotoxin MII (MII) plus EtOH on DA transient frequency with scatterplots of individual normalized values superimposed on the means ± SEM bars. MII (100 nM) prevented EtOH (5 mM) enhancement of DA transient frequency. E: Dose-response for EtOH (1–80 mM) effects on DA transient amplitude. Ethanol significantly enhanced the amplitude of DA transients at the 5 mM level. The inset shows the DA transient amplitude distribution (normalized for frequency) for control and EtOH (5 mM) exposed slices. F: MII (100 nM) significantly reduced EtOH (5 mM) enhancement of DA transient amplitude without having an effect on its own. There was also a significant difference between MII alone and MII+EtOH. Values in parentheses represent n values. Asterisks *, *** represent significance levels P<0.05 and 0.001, respectively.
