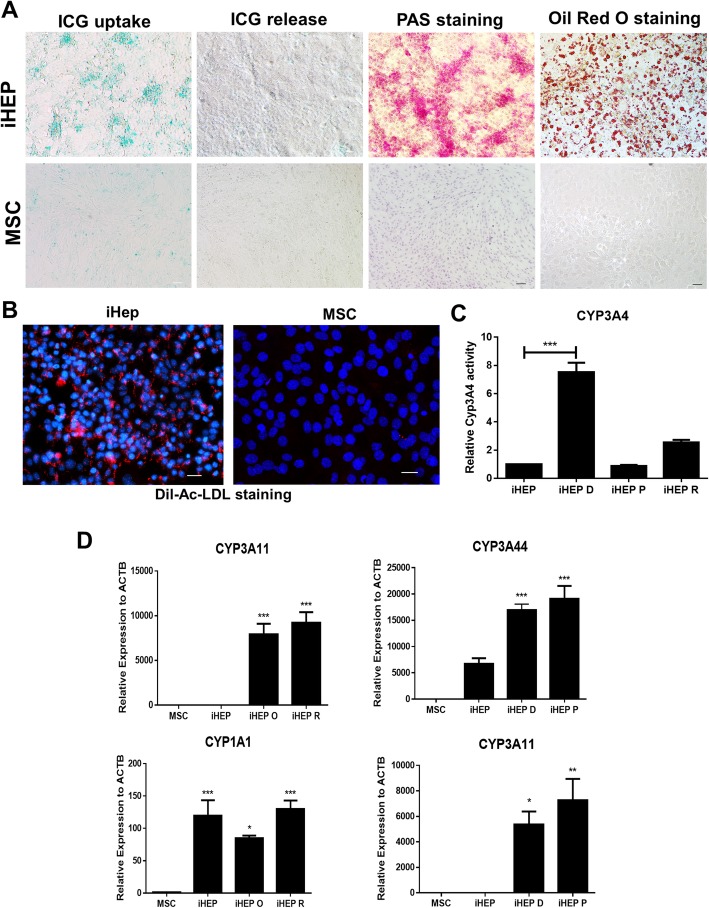
Fig. 3.
iHEPs display hepatocyte functions. Functional evaluation of iHEPs compared to MSCs, by ICG uptake and release, PAS staining, and Oil red O staining (a). LDL uptake evaluation (Ac-LDL, seen in red fluorescence), nuclei stained with DAPI (blue) (b). Evaluation of Cyp3a4 activity in response to 100 μM dexamethasone (iHEP D), 30 μM rifampicin (iHEP R), or 1 mM phenobarbital (iHEP P) (c). RT-qPCR analysis of mRNA expression levels of Cyp450 enzymes in response to 100 μM dexamethasone, 30 μM rifampicin, 1 mM phenobarbital, or 50 μM omeprazole (iHEP O). Expression levels were compared with non-induced iHEPs and MSCs (d)

