Fig. 5.
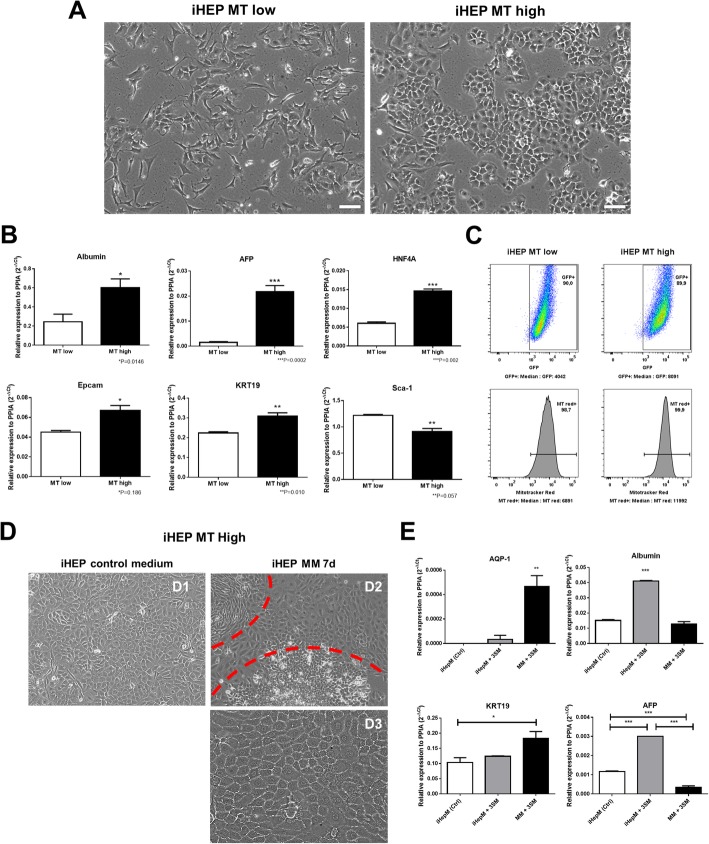
Mitochondrial content reflects different subpopulations in late iHEP cultures. Phase-contrast images obtained from iHEP cultures after mitochondrial content-based cell sorting for isolation of iHEP MTHigh and iHEP MTLow supopulations. Bars 100 μm (a). RT-qPCR analysis of albumin, AFP, HNF4α, Epcam, KRT19, and Sca-1 mRNA levels, comparing the two populations (b). Relation between intensity of GFP fluorescence (Hnf4α-reporter) and MitoTracker staining. MTHigh and MTLow iHEPs were labeled with MitoTracker Red FM and analyzed by flow cytometry (c). Morphological alterations observed by phase-contrast microscopy in iHEP MT High subpopulation after being exposed to maturation media for 7 days. Bar 100 μm (d). RT-qPCR analysis for quantification of aquaporin-1, Afp, and albumin mRNAs after maturation protocols. *p < 0.05; **p < 0.01; ***p < 0.001 (e)

