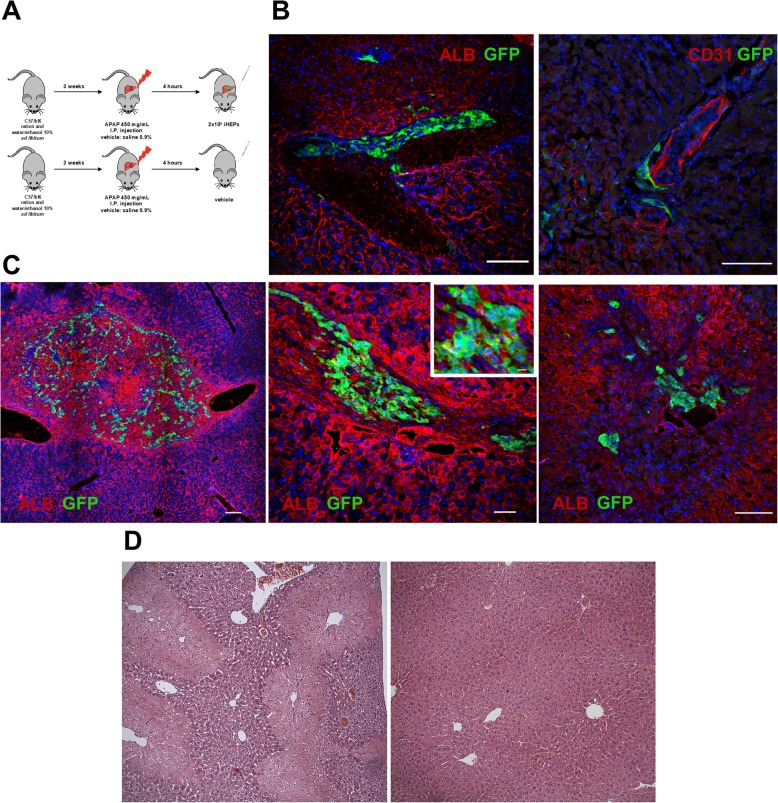
Fig. 6.
Evaluation of liver repopulation capacity of iHEPs in the APAP acute liver injury model. Experimental design (a). Confocal microscopy of liver sections obtained from iHEP-transplanted mice 48 h (b) or 7 days (c) after cell transplantation. iHEPs are visualized by GFP expression (green), while albumin or CD31+ vessels are seen in red. Nuclei were stained with DAPI (blue). Inset shows a detail for observation of Alb/GFP double staining. Scale bars 100 μm (b, c; right), 200 μm (c; left), 50 μm (c; middle). Representative images of H&E-stained liver sections showing extensive areas of centrolobular necrosis 48 h after APAP injection (d; left) and complete restoration of normal architecture 7 days after APAP injection (d; right), with no signs of ectopic proliferation

