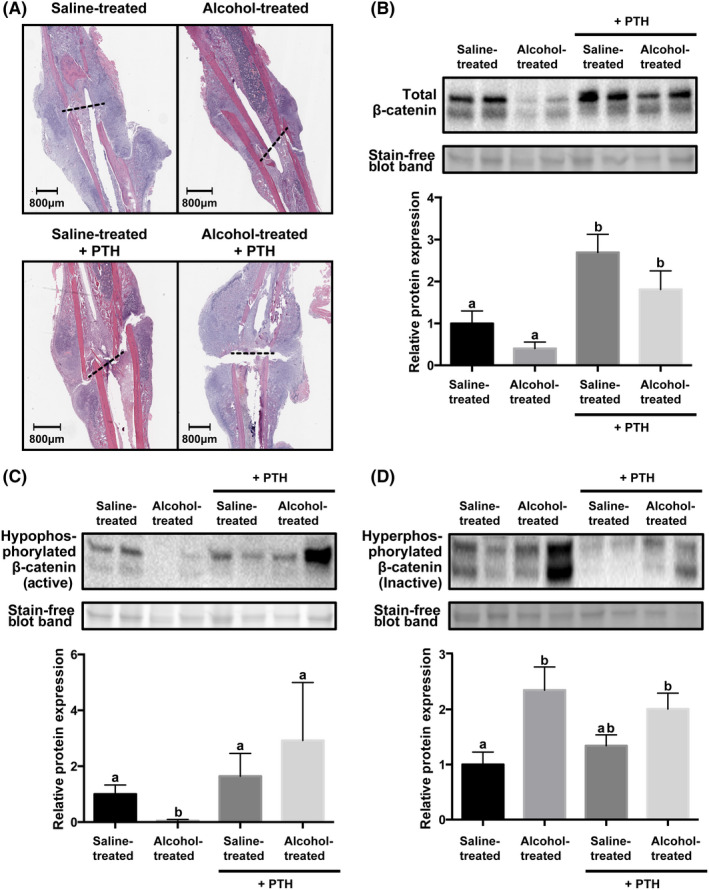
Figure 3.

β‐catenin protein expression in callus tissue with or without intermittent parathyroid hormone treatment. (A) Representative hematoxylin and eosin stained histological samples from each treatment group. Fracture site is marked by a dashed black line. Western blot of (B) total β‐catenin; (C) hypophosphorylated (active) β‐catenin; and (D) hyperphosphorylated (inactive) β‐catenin. Corresponding quantification is graphed underneath each plot. Data are mean ± SEM are represented as the densitometric ratio of each experimental group relative to the saline‐treated animals. n = 5‐6, P < .05, Kruskal‐Wallis test. Groups not sharing a letter (eg a, b) are significant. Groups sharing a letter (eg a, a) are not significantly different
