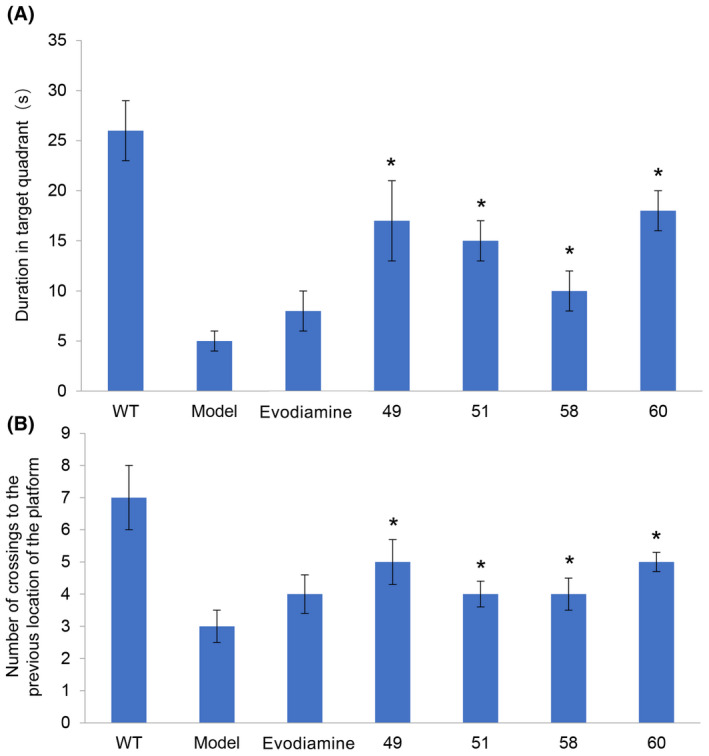
Figure 4.

Behavioral performance of animals in the Morris water maze. A, Time spent in the quadrant that previously contained the platform (n = 7, *P < .05, evodiamine derivatives 49, 51, 58 and 60 vs APPswe/PS1ΔE9). B, Number of crossings to the previous location of the platform (n = 7, *P < .05, evodiamine derivatives 49, 51, 58 and 60 vs APPswe/PS1ΔE9)
