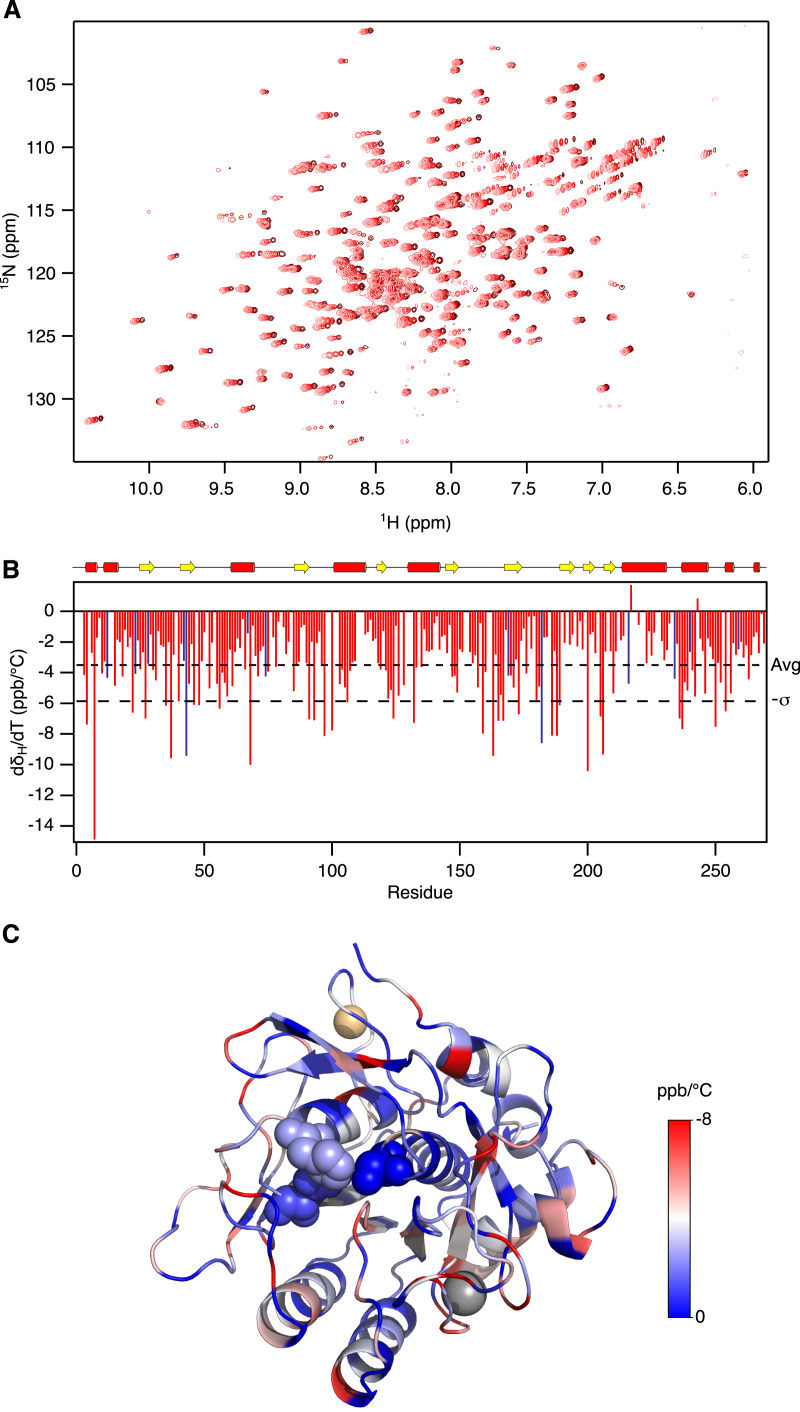
Figure 1. Temperature induced chemical shift changes in Savinase.
(A) 15N-HSQC spectra recorded at 18 °C, 22 °C, 26 °C, 30 °C and 34 °C in colours from light to dark red. (B) Temperature coefficients for the backbone amide proton chemical shifts plotted against sequence number. The dashed lines show the average temperature coefficient (Avg) and one standard deviation (−σ). (C) The structure of Savinase is colour coded according to the temperature coefficients shown in panel B. The colour scale is shown to the right of the structure. The metals as shown as spheres, Ca2+ (grey) and Na+ (orange). The catalytic triad in the active site is shown with spheres.

