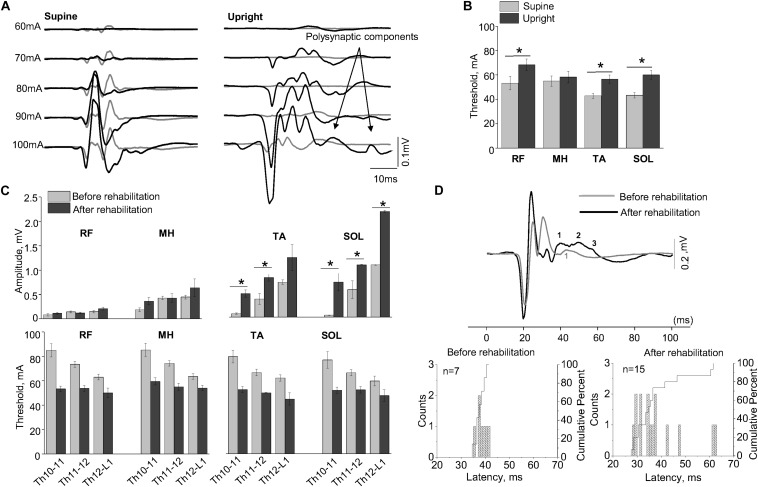
FIGURE 3.
(A) Examples of the SEMP recorded from TA muscle during stimulation at Th11-12 level in supine and upright (less than 30% body weight support) positions after the first verticalization before (gray lines) and after rehabilitation therapy (black lines). (B) The thresholds of the SEMP recorded in supine (gray lines) and upright (less than 30% body weight support) position after the first verticalization (black lines) in TA, SOL, RF, and MH (n = 6). (C) Changes in amplitude and threshold of SEMP recorded from RF, MH, TA, and SOL in supine position before (gray) and after (black) rehabilitation therapy (n = 4). (D) Example of the SEMP recorded from TA during stimulation at Th11-12 level in upright position (less than 30% body weight support) before (gray line) and after rehabilitation therapy (black line). The black and gray numbers indicate the number of polysynaptic components of the SEMP. Histograms and cumulative percentage of latencies (ms) of polysynaptic components of the SEMP recorded from TA before and after rehabilitation. Counts – frequency of occurrence of latencies of LR in interval of 1 ms. Cumulative percent – cumulative percentage of frequency of occurrence of latencies of LR in interval of 1 ms. Difference marked with an asterisk indicates significance (*p < 0.05).

