
Figure 13.
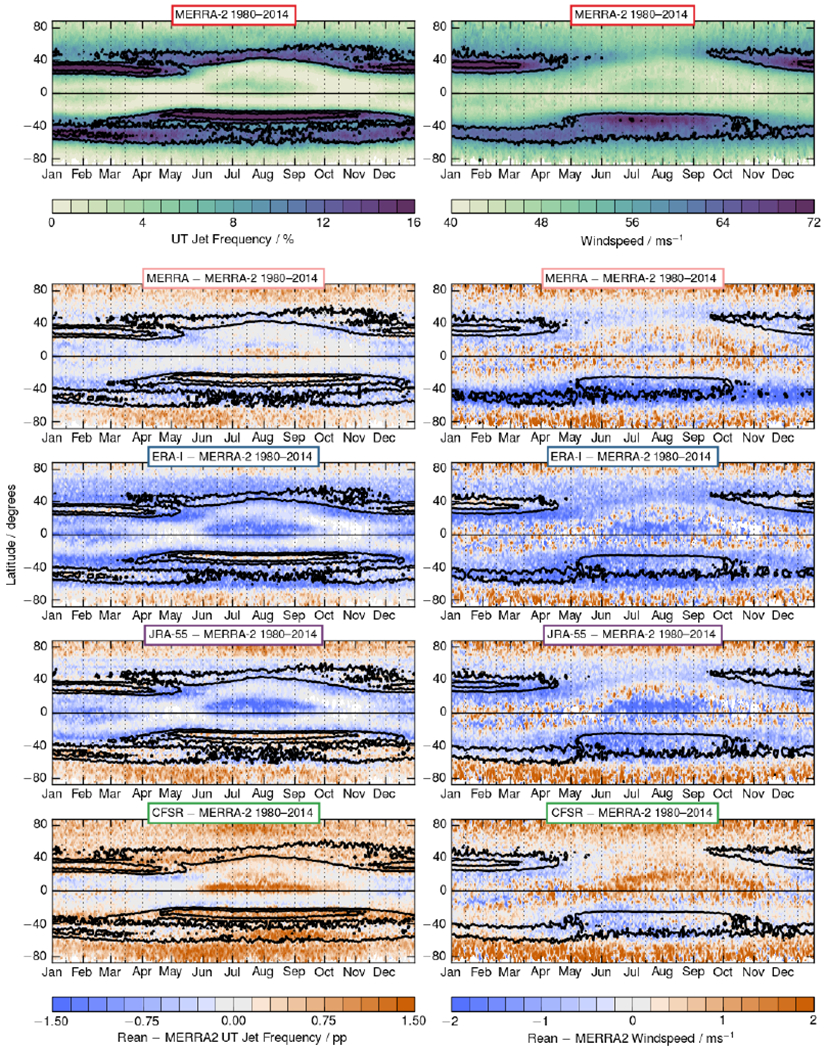
Climatological seasonal cycle in upper tropospheric jet frequencies for MERRA-2 compared with the other reanalyses. Jet frequency distributions are shown on the left, and mean windspeeds at jet cores on the right. Overlaid contours are climatological values for each reanalysis of 10 and 15% for frequencies and 60 and 72 ms−1 for windspeeds; the smallest value is always the largest or “outermost” contour. In the difference plots, blues/oranges indicate negative/positive differences.