
Figure 14.
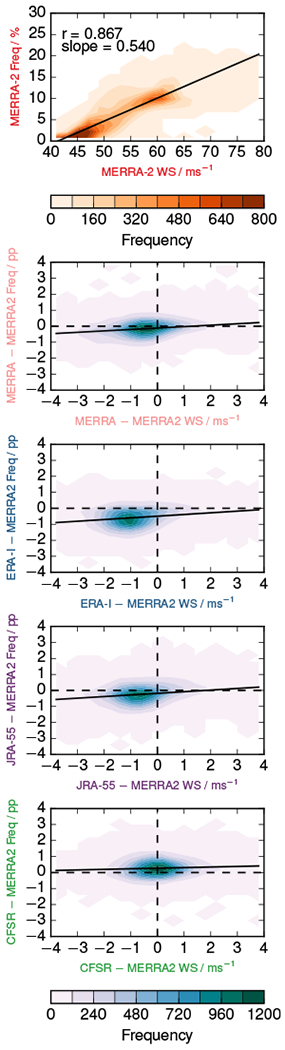
Density plots of (top) MERRA-2 climatological daily jet frequencies versus climatological daily jet windspeeds (values are from Figure 13), and of the corresponding (reanalysis — MERRA-2) frequency differences versus jet windspeed differences for (second to fifth rows) MERRA, ERA-I, JRA-55, and CFSR. Black lines are the linear fit to the distributions.