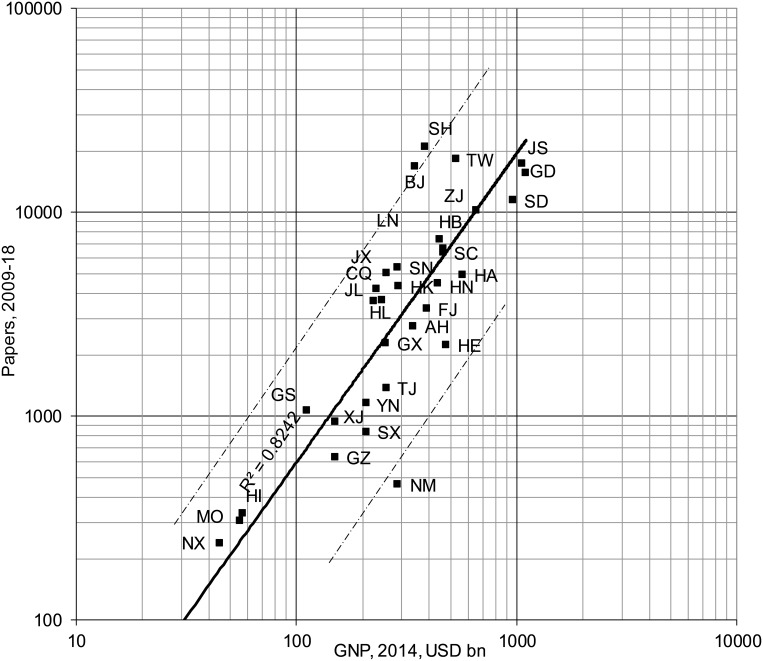
Figure 6.
Plot of outputs of Chinese cancer research papers from each province (for codes, see Table 1) in 2009–18 compared with its gross domestic product in 2014, US $ billion. Best fit line is a power law line; chain dotted lines show values x 5 or x 0.2 the least-squares line. Qinghai and Tibet not shown as their research outputs were below 100 papers.

