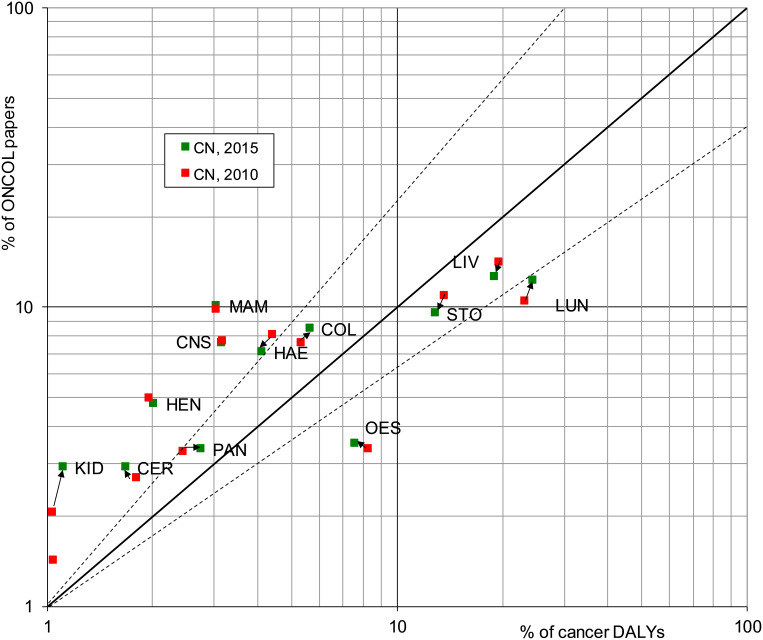
Figure 7.
Plot of Chinese cancer research outputs in two quinquennia, 2009–13 and 2014–18, on different anatomical cancer sites, and percentage of the burden from each cancer manifestation (relative to the total for all cancers) in 2010 and 2015 (from WHO data). Dashed lines show values twice or half those expected from the diagonal line of equality. For codes, see abbreviations list to Figure 2.

