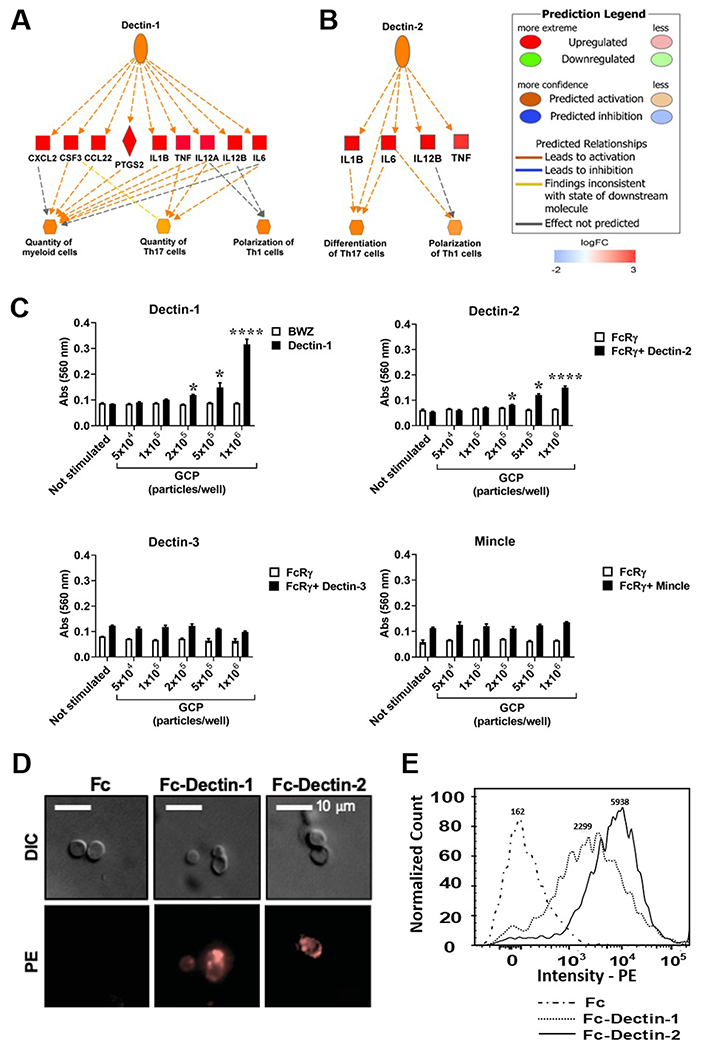
FIGURE 3.

Both Dectin-1 and Dectin-2 recognize GCP-rCpa1 vaccine. (A and B) The differentially expressed gene data were analyzed with regulator effect tools implemented in IPA to predict activation of upstream CLR members, Dectin-1 and Dectin-2, in response to the vaccine. Genes shaded in red are upregulated while green are downregulated. The intensity of the shading demonstrates the degree each gene that was upregulated. Color legend for line representation is illustrated on the upper right panel. (C) T-hybridoma cells expressing Dectin-1-CD3ζ (Dectin-1), as well as B3Z cells expressing Dectin-2 plus FcRγ (Dectin-2), Dectin-3 plus FcRγ (Dectin-3) and Mincle plus FcRγ (Mincle) were stimulated with the indicated numbers of GCPs. T-hybridoma BWZ cells, and B3Z cells only expressing FcRγ were used as controls. After 18 hours, lacZ activity was measured and expressed as OD560 values. Data are the mean ± SEM of triplet wells (Student t -test, *, P < 0.05; ****, P < 0.001). (D) GCPs were incubated with Fc fragment alone, Fc-Dectin-1 or Fc-Dectin-2, followed by staining with PE-conjugated with anti-human Fc antibody. GCPs bound with Dectin-1 and Dectin-2 were visualized with a fluorescent microscope (400x). (E) Overplayed histographs showed the binding intensity of Fc-Dectin-1 and Fc-Dectin 2 to GCPs. Medium fluorescence intensity (MFI) was shown on top of each histographs. GCPs incubated with Fc alone were used as a control.
