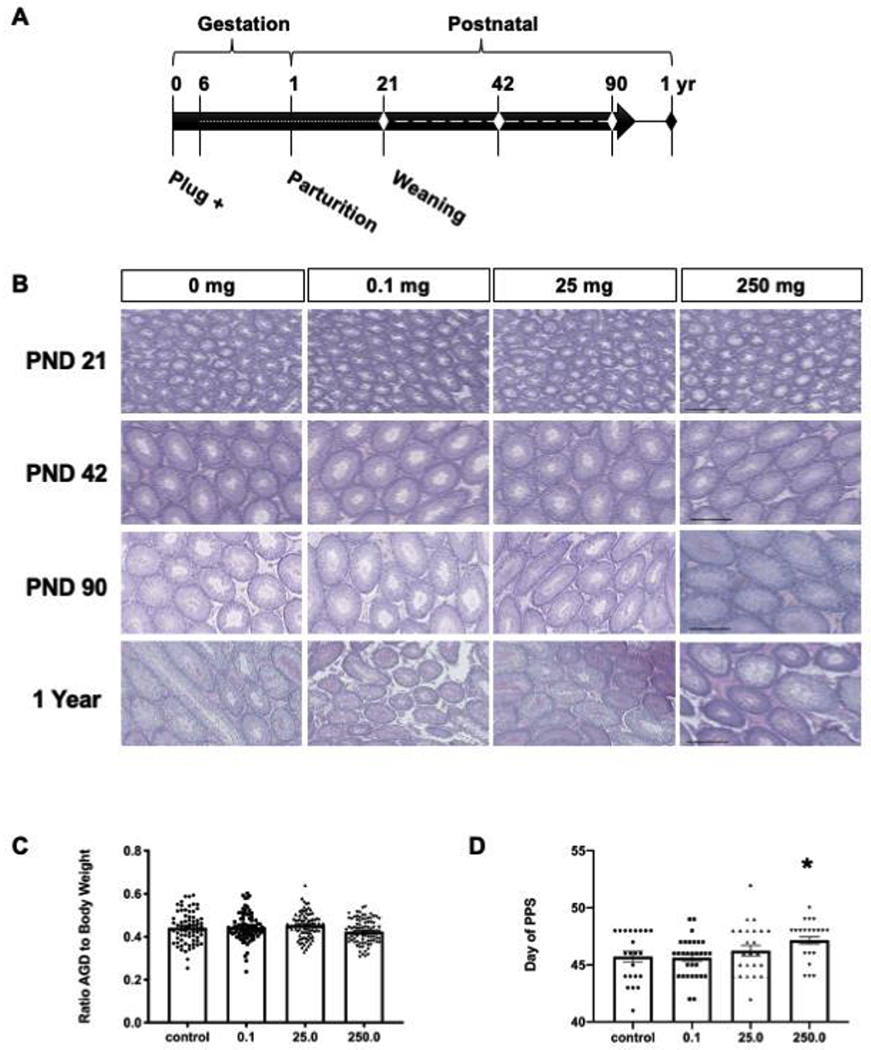
Figure 1.

(A) The schematic shows the study timeline. The dotted line represents exposure via dam and dashed line direct exposure to progeny. The diamonds indicate ages collected. (B) Representative testis sections stained with H&E for morphological assessment are shown. At least four males were examined in each age and dose group. Scale bars = 200 μm. (C) Anogenital distance was measured on PND four. Mean anogenital distance normalized to body weight, (n ≥ 73 per dose group). (D) The average age at preputial separation (PPS, n ≤ 24 per dose group). A significant delay (*) was observed in the 250 mg/kg group compared to control (Dunnett’s p = 0.0335, d = 0.1855). Error bars indicate standard error of the mean.
